Fishhook Signal For Gold

Free Chart In Focus email
Delivered to you every week
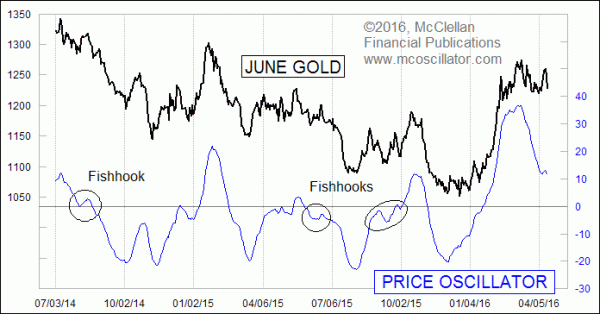
Gold revealed an interesting bit of information this week when it formed what we call a “fishhook” structure. Fishhooks are important because they can reveal the potential for a more powerful move.
For background on this signal, see this article in our Learning Center on “Fishhook Rules”.
The basic point is that a fishhook forms in the chart of a Price Oscillator (and some other indicators) after a high value top, and then as the Price Oscillator is working its way back down toward neutral, it turns up again briefly and then turns back down again. Fishhooks can also form in the other direction, after a deep bottom.
The best fishhooks form when the Price Oscillator is about halfway down to the zero line, although they can certainly form in other places. The one we saw this week is just about ideal, although that still does not guarantee it is going “work” perfectly. This business is not about getting guarantees, but a signal that reveals probabilities is a useful thing to watch for.
It is important to also note that an upturn halfway down to zero is not necessarily a fishhook structure until it turns back down again. If the Price Oscillator turns up and keeps rising, it is not a fishhook, it’s a real reversal.
The reason why a fishhook is such an important structure is that it reveals a failure by the forces of reversal. In gold’s case, the bulls tried to start a rally again, but then quit after only 4 days of upward price movement. This shows us that they just did not have the ammunition to mount a meaningful rally when they had the opportunity, and so that means they probably don’t have the capacity to stop a further decline anytime soon.
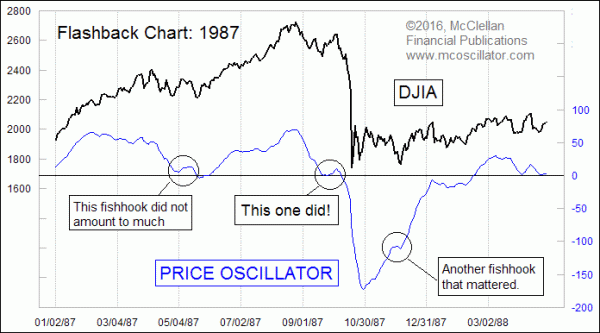
The stock market in 1987 showed us two of the most important lessons about fishhooks. Here is what I mean:

The first point is that a fishhook represents potential for a powerful resumption of a trend. But not all fishhooks work out that way. The one which formed in May 1987 did not result in anything more than just a retest of the prior low. But a nearly identical looking fishhook in early October 1987 brought a much bigger selloff, and showed the potential that a fishhook can represent.
So the message to take away from this new fishhook structure in gold prices is that it tells us there is the strong potential for a big decline, something which the COT data have been calling for recently, as we have discussed each Friday in our Daily Edition.
Tom McClellan
Editor, The McClellan Market Report
Feb 04, 2016
GLD Assets Show Resurgent Interest in Gold |
Mar 11, 2011
DJIA Price Oscillator |
Oct 30, 2015
COT Data For Gold At Topworthy Level |