Fishing Around For a Gold Cycle Bottom

Free Chart In Focus email
Delivered to you every week
The price bottom associated with gold's 13-1/2 month cycle is ideally due right now. The problem is that gold does not always bottom exactly when it is supposed to, and there is still work yet to do. By that I mean that there are tasks associated with this cycle bottom which gold has not yet accomplished.
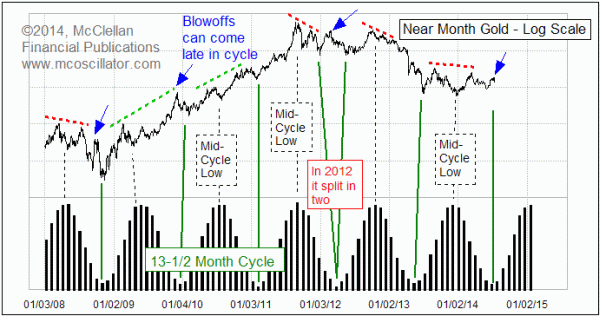
I mentioned back in April 2014 that gold was currently in "left translation" for this current cycle, and that this implies we should see a price low at the cycle bottom which goes below the December mid-cycle low. That means a dip to below around $1190/oz.
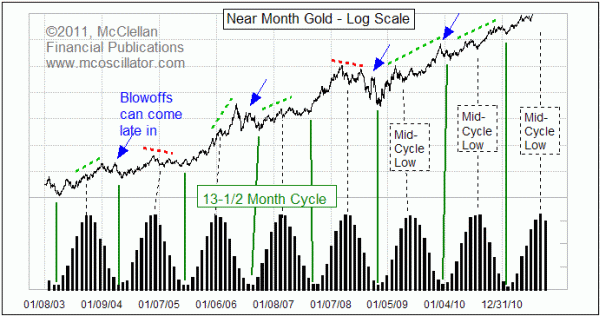
There is another feature of some of these cycles which I believe is making an appearance this time, and that is the tendency to see a late blowoff move just ahead of the final cycle low. The blue arrows in the chart above highlight some examples of this behavior, and it is not just a recent phenomenon. Here is a look back further in time, to show that this tendency for a late blowoff has been with us for a long time.

These late blowoff moves do not appear in every iteration of this cycle. But they do appear often enough to allow us to understand that it can be a regular part of the cycle behavior. But the difficulty stems from the fact that it is really hard to differentiate a potential late blowoff move from the initiation of a new upward phase for the next cycle. This is especially hard, given that the real final price bottom can arrive up to a month early or late versus the idea date. The question is whether an up move is starting the new up phase of a new cycle, or is it just a late blowoff at the end of the last cycle, ahead of a plunge to a lower final low?
That's the rub, and it is quite often very difficult to tell. So one way to deal with that is to take every buy signal when the major cycle low is near, accepting the risk that the market might suddenly move against you but the big up move will bail you out in the long run. I confess that I have trouble with that approach, because I like to be more precise. That approach does not always work out in my favor.
For the current situation, I have been remaining bearish in spite of the June 2014 pop, and counting on the promise of a lower price low at the major cycle bottom, lower than the mid-cycle low seen back in December 2013. That means a dip to below the $1190/oz level at some point between June and August 2014. We have a month left for that to get done.
That expectation comes from the fact that we have had "left translation" in this current cycle, meaning that the price top before the December 2013 mid-cycle low was above the price top after that mid-cycle low. Whenever left translation occurs, the expectation is that the price of gold will dip below the level seen at the mid-cycle low when the major cycle bottom arrives.
If we do not see a price low below that Dec. 2013 level ($1190/oz) at this major cycle low, then this would be the first time in 2 decades that there has been left translation which did not "work". It might seem to be extreme to look for another $100/oz decline in gold prices within the next month, but it is more extreme to make a bet that something which has worked consistently for at least the past 3 decades will suddenly fail this time.
Given all of this information, my interpretation is that the June 2014 pop in gold prices is another example of this late blowoff behavior, and that we still have the final "thud" yet to come. If that final down move arrives before late August, it would still be considered to be a case of the cycle bottom arriving "on time", given that +/- 1 month tolerance.
As a final note about gold, it was personally fun for me to have Timer Digest say that I am the #1 Gold Timer thus far for 2014, although there are still 6 months yet to go.
Join the legends of Technical Analysis in Seattle on August 8 and 9. John Murphy, Martin Pring, Alexander Elder, Richard Arms, Arthur Hill and more! Visit http://stockcharts.com/chartcon for more details.
Tom McClellan
Editor, The McClellan Market Report
Aug 22, 2013
Gold’s 13-1/2 Month Cycle |
Apr 17, 2014
Gold’s Cycle is in Left Translation |
Nov 19, 2010
Is Gold Overvalued? |