Gold Says Oil Prices Heading Higher into 2022

Free Chart In Focus email
Delivered to you every week
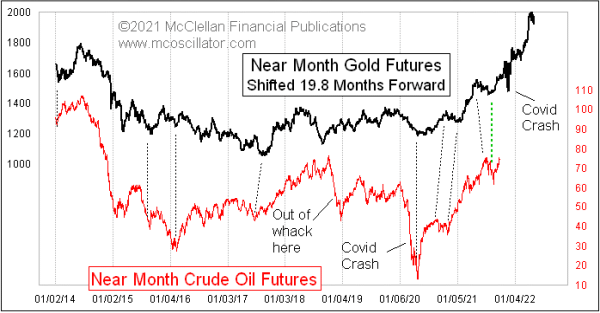
I like getting answers ahead of time, especially answers about the financial markets. One of the best answer-givers I have found is the movements of gold prices. Gold leads grain prices by about 15 months, bond yields by 20-1/2 months, and in this week’s chart we see that it leads oil prices by just shy of 20 months.
To create this chart, and reveal that relationship, I have offset the plot of gold futures forward by 425 trading days, or just under 20 months. This is similar to the 20-1/2 month lag time seen in how bond yields echo gold price movements, and that is not a coincidence. Yields react to inflation worries, and oil prices are a big part of those inflation worries.
I do not know exactly why oil prices (and yields) react to gold price movements with this exact lag time amount. But I have seen it working this way for years, and so at some point one realizes that there is enough data to accept a phenomenon, even if one cannot explain it.
20 months ago, gold prices were just starting upward out of a brief consolidation around the $1500 level, and went on to make a top above $2000 on August 6, 2020. Counting forward by 19.8 months from then gets us to an ideal top due around April 2022 for oil prices.
Now, one thing we should not do is look at the magnitude of gold’s price move, and use that to calculate a future oil price level. The relationship just does not work that precisely, and the magnitudes can vary a lot. This model gets the timing pretty good, most of the time, but the magnitudes can differ. I have found, however, that if I get the timing right, the magnitudes will take care of themselves.
An example of that principle was the big oil price dip related to the Covid Crash. It arrived right on schedule, but Covid magnified the oil price move downward as everyone stopped going to work for a while. And then oil’s price rebound was also magnified as everyone suddenly did go back to work. But the price patterns did look similar, in spite of that magnitude difference.
Just ahead on gold’s pattern is the echo point of the March 2020 Covid Crash, an exogenous event which caused a brief deviation for gold prices, and then a quick return to the established path. My expectation is that oil prices do not have to echo that particular movement in gold’s price plot.
And even if we do see oil echo that, we should all still get ready for higher oil prices lasting into spring of 2022.
Tom McClellan
Editor, The McClellan Market Report
May 21, 2021
Pause Coming For The Rise In Interest Rates |
Apr 02, 2021
Clarifying Oil’s 10-Year Message For Stocks |
Nov 15, 2018
Oil’s Drop Bigger Than Called For, But Right On Schedule |