Oil’s Leading Indication for Yields Working Again

Free Chart In Focus email
Delivered to you every week
Last week I discussed how gold prices give a leading indication for the movements of oil prices just under 20 months later. That model calls for higher oil prices going into 2022.
And back in May, I shared gold’s 20-1/2 month leading indication for interest rates, which also calls for a movement higher into 2022 for bond yields.
So the natural next step is that if gold leads oil by 19.8 months, and gold leads bond yields by 20-1/2 months, then crude oil prices ought to lead bond yields by a little bit. And that relationship actually was one that I relied on in the past quite a lot, but I put it away last year when Covid threw a monkey wrench into the relationship. It is arguably back to working again now.
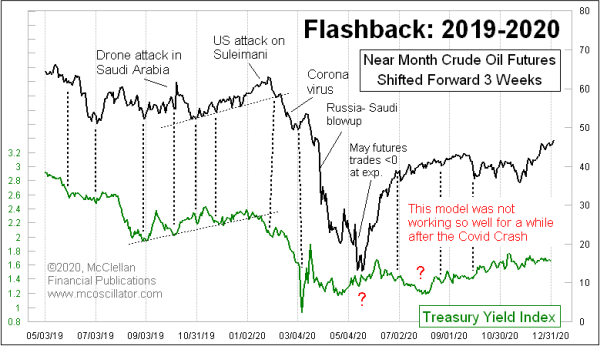
Here is what I saw last year that led me to temporarily abandon using that leading indication:

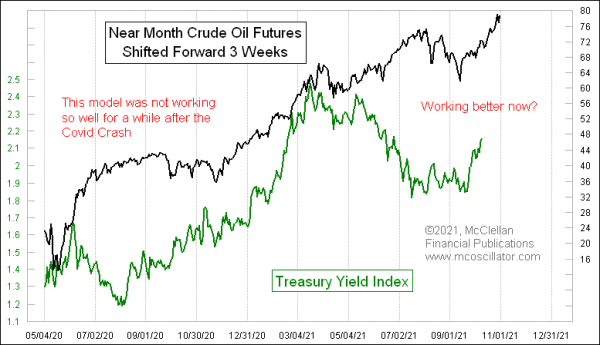
Up until early 2021, the relationship was working just great. And let me emphasize the point that the plot of crude oil prices in both of these charts is shifted forward by 3 weeks, to reveal how the replication of oil’s price movements by bond yields happens after that lag time. In other words, what happens in crude oil prices would happen again 3 weeks later in bond yields.
Covid threw all of that into disarray, as the disruption of having people stop flying in airliners and driving their cars ruined the economic message from oil prices. Now that the oil market is slowly returning to being an actual “market” again, the message of oil prices is arguably starting to work again.
Crude oil future prices bottomed on August 20 at $62/barrel, and is now pushing on the $80 level. The Treasury Yield Index (TYX) bottomed on Sep. 20, just a little bit more than 3 weeks later, and has been following oil’s price rise higher. Given that the past 3 weeks of oil price movement have been higher, that implies bond yields should continue rising for at least that long.
The key takeaway point from this week’s missive is that no matter how great a leading indicator may be working, it is possible to have an exogenous event come along every so often and disrupt that message, either briefly as in the case of middle east events, or in a more long lasting way as was the case with Covid. The disruption does not mean that the relationship is ruined forever, just that it is disrupted for a while. This one seems to be getting back into correlation once again.
Tom McClellan
Editor, The McClellan Market Report
May 21, 2015
Crude Oil Leads Bond Yields |
May 21, 2021
Pause Coming For The Rise In Interest Rates |
Sep 30, 2021
Gold Says Oil Prices Heading Higher into 2022 |