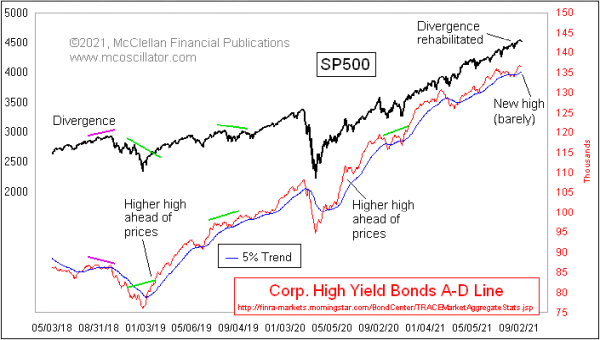
High Yield Bond A-D Line Resolves Divergence

Free Chart In Focus email
Delivered to you every week
High yield corporate bonds (AKA junk bonds) trade more like the stock market than like T-Bonds. They are considered to be more subject to default risk, and thus to the forces of financial market liquidity that drive the stock market up and down. That liquidity is the important factor, and thus the HY bonds can give us another viewpoint into understanding the health of the liquidity stream.
Just a few weeks ago, there developed a troubling divergence between the HY Bond A-D Line and the SP500. It said that there was trouble in liquidityville, and that such trouble might eventually come around to bite the big cap stocks which drive the SP500. A similar divergence developed before the ugliness of late 2018, seen at the left end of the chart. And an even worse looking one appeared in 2007 (not shown here) ahead of the final October 2007 stock market top. So these divergences can be a big deal.
It is also a big deal when an apparent divergence gets rehabilitated, which can happen, and which has happened in this current case. The HY Bond A-D data were looking bad, but suddenly started improving. This A-D Line has now resolved its divergence, and moved ahead to a higher high.
The message is that whatever liquidity problem was happening before has now been resolved, and liquidity is restored. For how long is a separate question. It is possible that another divergence could develop and point to a major top in the weeks ahead, and if that happens I will be calling attention to it in The McClellan Market Report and The Daily Edition. It is worth noting that the NYSE’s Daily A-D Line has still not made a higher high.
Tom McClellan
Editor, The McClellan Market Report
Aug 27, 2021
A-D Line’s Troubling Divergence |
Feb 04, 2021
Bond CEF A-D Line Confirming Higher Price Highs |
Mar 12, 2021
Another New A-D Line High |