Important Points About The Minimum Wage
Free Chart In Focus email
Delivered to you every week
The "Engineer's Question" is this: "What problem are you trying to solve?" Once you can answer that, the solution is much easier to arrive at. The follow-on questions are: Does the proposal solve the problem? and also, Is the proposal the best or most cost effective solution to the problem?
Engineers (of which I consider myself one) can be really annoying in the way they zoom right in on the problem, and set aside proposals that get in the way of actually solving the problem. When asked the classic question about the glass being half-full or half-empty, an engineer will quietly explain that the glass is adequate to contain the available fluid, with a safety factor of 2.0.
Just recently, the subject of a potential minimum wage hike has become a popular topic of national debate. Taking a look at the history of such rate hikes may help to inform the participants in that debate.
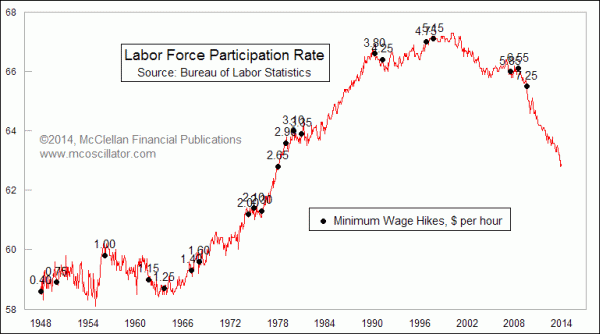
In the chart above, I am showing the labor force participation rate (as published by the Bureau of Labor Statistics). Highlighted on that chart are changes in the federal minimum wage. Generally speaking, the imposition of a hike in the minimum wage tends to have a downward effect on labor participation. So if the goal is to get more Americans into the workforce, a minimum wage hike would seem to run contrary to that goal.
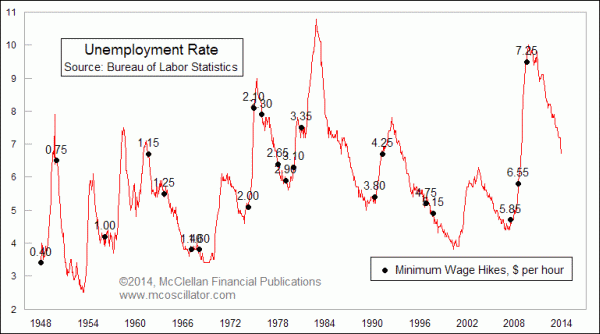
Here is another way of looking at the effects of minimum wage hikes over the years. In this next chart, I show the overall unemployment rate in the U.S., with minimum wage changes highlighted. A series of 3 separate hikes was started in July 2007, and that series coincided with the big rise in unemployment in the U.S. The housing market collapse and the ensuing financial crisis assuredly had some effect as well, but setting a higher price on putting a new low-skill worker to work is understandably going to have a depressing effect on employers wanting to do that.
Less than 3% of all workers in the U.S. are employed at the federal minimum wage, and 2/3 of minimum wage earners receive a raise within a year. See this excellent article by Erin Shannon of the Washington Policy Center.
A higher minimum wage has a noticeably negative effect on employment of younger workers. Here is the unemployment rate for 16-19 year olds:
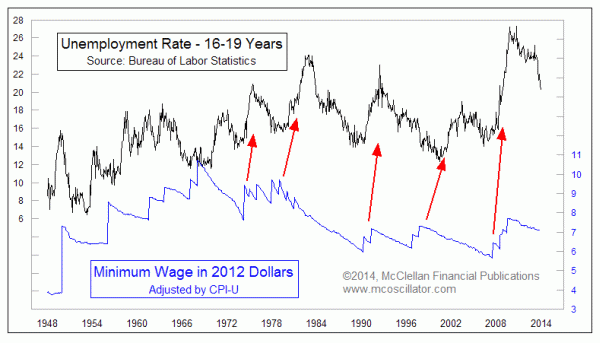
In inflation-adjusted terms, the current minimum wage is still relatively high compared to levels of the past 20 years. And whenever the minimum wage has been raised, there has been an adverse effect on this unemployment rate.
It is a somewhat lagged response, with the corresponding rise starting anywhere from a few months to a couple of years later. If you move the minimum wage line upward, you can be pretty confident that it will then move the unemployment line upward a short time afterward.
So coming back to the "Engineer's Question", if the problem were having too many workers in the workforce, then raising the price would help solve that "problem". But if instead the problem is defined as not having enough people working, then a minimum wage hike won't help solve that particular problem.
Tom McClellan
Editor, The McClellan Market Report
Aug 13, 2010
Brightening Prospects For Employment |
Jul 25, 2013
Is Shrinking Arctic Ice a Bad Thing? |
Dec 27, 2012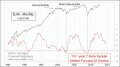
Another Use For the Yield Curve |