Is JPM “The Burning LOH”?

Free Chart In Focus email
Delivered to you every week
"The target is marked by the burning LOH."
When I was an reconnaissance helicopter pilot in the Army many years ago, that was a popular saying that was passed down by the more experienced pilots, some of whom had flown during the Vietnam War. It was meant to convey our own frailty, and the foolishness of being too eager about finding the enemy's location.
LOH back then stood for Light Observation Helicopter, either a Hughes OH-6 Cayuse or a Bell OH-58. It was pronounced as "loach". They were 4-seat commercial helicopters that were bought by the Army and adapted for use in scouting for enemy forces. A pilot had little more than his eyes and his wits as weapons, and the .040" aluminum skin and Plexiglas windows were not much protection from enemy fire. The idea was to fly low, using the terrain for cover and concealment, and try to find the enemy so that fighter planes or attack helicopters could be called in to deliver ordinance on the enemy's position.
But given the fact that enemy soldiers are usually not stupid, and don't want to be spotted, often the first indication that a pilot had located the enemy's position was that he was taking fire from the enemy. A lot of them got shot down. So then another helicopter crew would step in to radio the fast movers and guide them into the target. The fighter pilots would acknowledge that call, and the existence of enemy fire in the area, and then ask:
"Roger, how is the target marked?" The question was about the possible use of colored smoke, landmarks, or other features that can be seen while zooming in at 500 MPH.
And the answer would be, "The target is marked by the burning LOH."
There is a corollary to this in the financial markets. Quite often at the end of a big price move, we learn about a big institution blowing up because they did not think that the trade would go so far against them. The 2006 case of Amaranth Advisors would be a classic example, with its bankruptcy in late 2006 marking the bottom for natural gas prices ahead of the big commodity bubble in 2008. There were several portfolios that blew up at the top of that bubble.
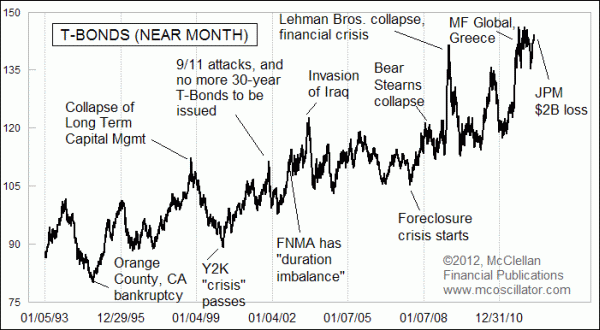
In this week's chart, I have labeled several notable news events that served as markers of important turns for T-Bond prices. Back in 1994, Orange County, California went bankrupt because its treasurer, Robert Citron, had overextended his bets the wrong way in the bond market. That bankruptcy marked the bottom for the big price decline. Orange County was the burning LOH.
In late 1998, the money management firm Long Term Capital Management (LTCM) famously made huge bets on T-Bonds that were based on the limits of how far price moves had historically gone in the past. And the market taught them a lesson about how trends can persist longer than one can stay solvent. The Federal Reserve had to intervene, lining up several major banks to help take apart LTCM's positions and keep it from cascading into a bigger problem. LTCM's collapse was the burning LOH for that up move.
More recently, the collapses of Bear Stearns, Lehman Brothers, and MF Global each coincided with peaks in bond prices. Each was the burning LOH for its particular moment in history.
So now this week, we find out that J.P. Morgan Chase (NYSE:JPM) has suffered a $2 billion loss on financial derivative bets that went bad. And this news comes as T-Bond prices are once again getting back up to the price levels seen at last year's MF Global collapse. The implication is that the news of JPM's big loss is serving as the "burning LOH" of this current time frame, and the news arrives just as the stock market is about at the end of the corrective period suggested by both our eurodollar COT leading indication and the Presidential Cycle Pattern. Subscribers to our twice monthly newsletter and our Daily Edition have been watching the current stock market correction unfold pretty much right on schedule relative to those models, and now we have a portfolio blowup to help mark the beginning of the end of that corrective process.
Tom McClellan
Editor, The McClellan Market Report
Feb 03, 2012
Eurodollar COT Indication Calls For Big Stock Market Top Now |
Nov 05, 2010
Entering the 3rd Presidential Year |
Aug 27, 2010
60-year Cycle In Interest Rates |