Junk Bond Strength is Bullish For Stocks

Free Chart In Focus email
Delivered to you every week
High-yield bonds, or “junk” bonds, are corporate bonds, but they trade a lot more like the stock market than they do like T-Bonds. What’s more, they are much more liquidity sensitive than most stocks, and so when liquidity turns bad (or good), it often shows up first in the behavior of junk bonds.
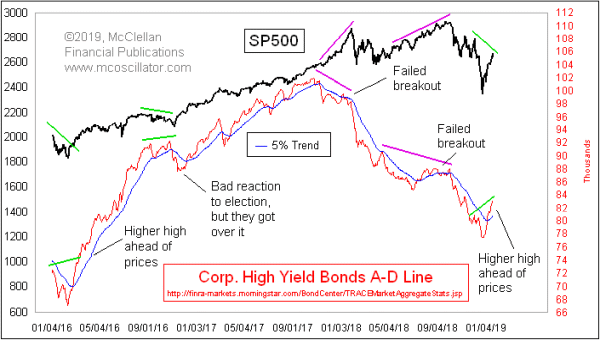
FINRA publishes each day the Advance-Decline (A-D) data for corporate bonds, breaking them down into different categories. This week’s chart features a cumulative Daily A-D Line for FINRA’s “high yield” category. I don’t know how they make their determinations of which bonds fit into which groups; that’s up to FINRA, and is not something I can control so I don’t worry about it. But I really do appreciate them making these data available, because of what a great indicator this A-D Line is.
It told us ahead of the Jan. 2018 market top that there was trouble brewing. Even the NYSE’s A-D Line failed to show us a divergence ahead of that one. And this A-D Line reiterated that liquidity problems were present at the October 2018 price top.
Now we are seeing a much different message. Junk bonds have led the way higher coming out of the Dec. 24 bottom, moving up above the 5% Trend, and now making a higher high ahead of prices. It did this same behavior back in early 2016, correctly telling us then that liquidity had been restored after the ugliness of late 2015 and January 2016.
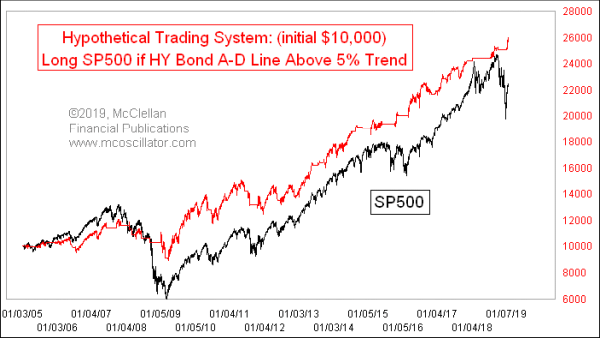
Having a strong A-D Line for high-yield bonds is a message of strength for the stock market. To demonstrate this, here is a hypothetical trading system that goes long the SP500 if this A-D Line is above its 5% Trend, or out to cash if it is below that EMA:

This is not an actual equity curve, and not an ideal trading system. It exits early at tops, and has a delay getting back in after bottoms. And I did not make allowance for commissions, dividends, interest on cash, or other factors that are important in a trading system design. I would not recommend anyone actually trade based on just this signal. I am just featuring it here to help reveal how important it is for the health of the SP500 to have junk bonds showing strength like they are showing now.
Tom McClellan
Editor, The McClellan Market Report
Jan 11, 2018
The Chart That Worries Me: HY Bond A-D Line |
May 25, 2017
Junk Bonds Don’t Confirm Higher Highs |
Dec 27, 2018
Finally a 10-1 Up-Volume Day |