Narrow Range for McClellan Oscillator

Free Chart In Focus email
Delivered to you every week
A quiet market is one of the hallmarks of a price top, when no one seems to care enough about risk to move the market very much in either direction. The NYSE’s McClellan A-D Oscillator has recently been displaying some of that quietness, trading only a few points above and below zero until just the past couple of days. That quietness in Oscillator readings is telling us something about that very complacency I was talking about.
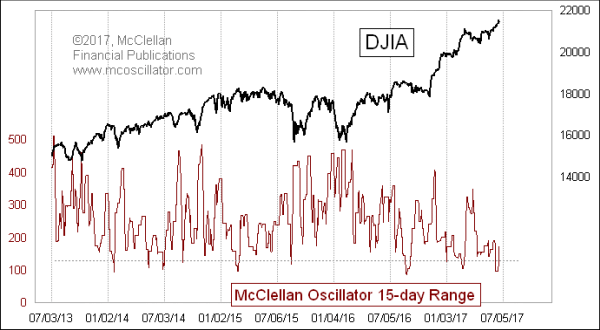
So to look at it more quantitatively, this week’s chart looks at the 15-day high-low range of Oscillator values. It’s calculation method disregards at what point level that range occurs; it is just looking at the highest minus the lowest readings over the past 15 trading days. What we can see in this chart is that the high readings occur near inflection points, usually as prices are turning up. This makes sense. Think about a nice oversold (very low) Oscillator reading, which is then followed a few days later by a crossing of zero to a nice high reading. That is going to increase the magnitude of the readings for this 15-day range indicator.
But it is the low readings for the 15-day range that I find even more interesting, because they tell us more about what is going to happen, as opposed to what just did happen. These low readings, below around 120 points, seem to give pretty good signals that a price top is at hand. This is similar to several other types of indicators that portray market calmness, such as Bollinger Bandwidth (AKA standard deviation), VIX, and Average True Range. Calmness of prices and investor complacency go together, and usually appear together at market tops.
A low reading like what we have just seen does not necessarily have to lead to a big price decline. But it does say that traders are feeling complacent, and thus that those who are going to be buying have likely done so, and thus there is little immediate pressure left to help push prices higher. Waiting for a fearful event, with its associated volatility and oversold readings, will get a better short term entry point.
This is a newfangled way of looking at McClellan Oscillator interpretation. For some of the more longstanding methods, check out our Learning Center chapter on the McClellan Oscillator. And to see a chart of the McClellan Oscillator updated every trading day, visit our Market Breadth Data page.
Tom McClellan
Editor, The McClellan Market Report
Dec 01, 2016
McClellan Oscillator for Corporate Bonds |
Mar 10, 2016
Highest McClellan Oscillator in 7 Years |
Oct 16, 2015
McClellan Oscillator Interpretation |