


Narrow Range of McClellan Oscillator Readings
Free Chart In Focus email
Delivered to you every week
Quietness in the stock market is a sign of a topping condition for prices. This phenomenon works this way because after an uptrend, people feel more confident, everyone is feeling fine, there are no perceived problems, and no need to get aggressive or ambitious with one’s trading. So price and breadth data show that quietness. But after a decline, people get more panicky, and that shows up with louder breadth numbers.
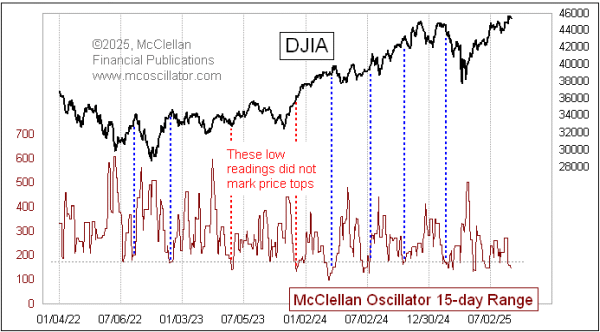
This week's chart shows an indicator which is a derivative of the McClellan Oscillator which my parents created back in 1969. The indicator looks at the Oscillator's values over the preceding 15 trading days, to see what the total range of values is. High readings mean that the Oscillator has been moving a lot, which reflects a more violent condition in the breadth numbers associated with a bottoming condition. But low readings like the one we see right now means everything is calm, which can be a topping condition.
Years ago I undertook a study to figure out what it means when the McClellan Oscillator gets quiet. I tinkered with lots of different lookback periods for the study, and found that 15 trading days seemed to work nicely. The principle is that quietness in the market which results in a small range of values in the McClellan Oscillator is a sign of a topping condition. It does not always work out that way, but it works often enough to pay some attention to. The data since July 2025 show not only very low readings like the current one, but also an overall shrinkage in values for this 15-day lookback indicator. We are seeing quietness indications getting doubled, in that this measure of quietness is itself acting quiet.
It is true that there are exceptions, when a low reading in this indicator fails to mark a price top. I have highlighted a couple of those in the chart. They fall into the familiar category of "no indicator is perfect".
Another point about this indicator is that it will not tell us how far prices might fall. All it says is that breadth data have been getting quiet, and that is a condition associated with meaningful price tops. What happens after that can be quite variable.
Tom McClellan
Editor, The McClellan Market Report
Jun 23, 2017
Narrow Range for McClellan Oscillator |
Oct 05, 2017
Another Narrow Range for McClellan Oscillator |
Aug 09, 2024
Fosback Absolute Breadth Indicator Shows the Oversold Condition |