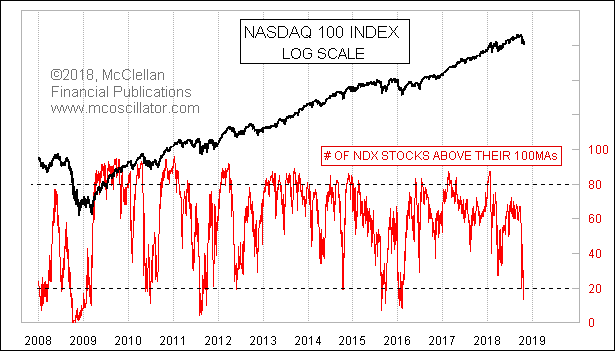
NDX Stocks Showing The Oversold Condition

Free Chart In Focus email
Delivered to you every week
The bearish seasonality of July to October got put off until the last minute, and now the stock market has tried to do 4 months’ worth of work in just a couple of weeks. One result of that cramming at the last minute is that a pretty deep oversold condition has arisen, which is evident in a variety of indicators, including this week’s chart.
As of Oct. 24, only 13 of the 100 stocks in the Nasdaq 100 Index are currently above their own 100-day moving averages. In case you’re wondering, those 13 are AAPL, CA, CDNS, CHTR, COST, ESRX, HSIC, ORLY, ROST, SBUX, TMUS, ULTA, and WBA. Aside from Apple Corp and Computer Associates, there are not a lot of “tech” leader stocks in that group. Even Amazon and Alphabet are excluded. The FANGs have taken the brunt of October’s dramatic selloff.
This week’s chart shows how the measurement of NDX stocks above their 100MAs has behaved over time. Readings above 80 or below 20 show extended conditions. There is a difference, though, between the meaning of high and low readings. Sometimes a very high reading can appear early in an uptrend, and is a sign of strong new initiation. Very low readings, on the other hand, are more reliably associated with oversold bottoming conditions.
Except in 2008. That year “broke” a lot of normal technical relationships and signals. This indicator went below 20 in September 2008, and it stayed there all the way until late January 2009, turning up and going back up above 20 before the Nasdaq 100 finished bottoming. It even got down to 0 at a couple of points in October 2008.
So if the market is a 2008 environment again, then we can figure on normal “rules” and relationships getting broken, and nothing working like it is supposed to. But if the October 2018 is a more “normal” pullback, then the oversold condition that this indicator (and others) is signaling is a sign of a bottoming opportunity.
Mar 18, 2011
Oversold McClellan Oscillator |
Jul 03, 2014
Alarming Sign in NDX Stocks’ Drawdown |
Aug 05, 2011
NDX Stocks Illustrate the Washout |