Silver COT: Commercials Betting Against Breakout

Free Chart In Focus email
Delivered to you every week
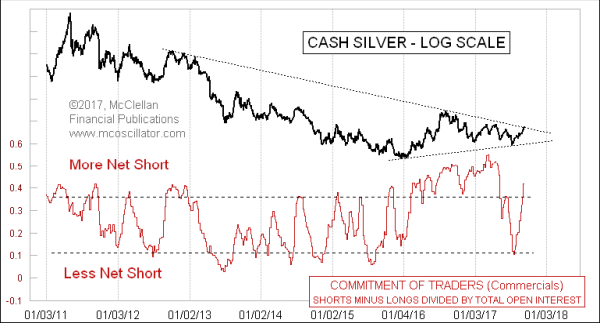
The price of spot silver is trying really hard to break a long term downtrend line, which would arguably be a bullish development if the breakout succeeds. But the big-money “commercial” traders of silver futures are betting heavily on a failure of that breakout attempt.
The Commitment of Traders (COT) Report is published every Friday by the CFTC, detailing futures positions held by traders in 3 different groups:
• Commercial traders are the big money, and usually the smart money.
• Non-commercial traders are large speculators.
• Non-reportable traders are ones whose positions are so small that the CFTC figures they are not worth tracking individually.
The COT data go back to 1986, and in all of that time the commercial traders have never actually been net long as a group. They vary between large and small net short positions, and so the analysis game consists of evaluating the current position relative to their recent range. On that basis, the latest data show a pretty high net short position, although not quite as big as the all-time record net short position that they held as a group earlier this year.
And this high net short position comes just a few weeks after they got to a 2-year low in terms of how short they were. That low point coincided with the low for silver prices at 15.39 back in early July 2017, a low COT reading which correctly foretold the rebound we have seen in silver prices.
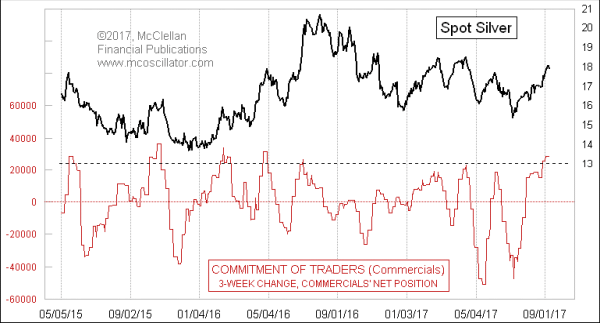
But that price rebound has led the commercial traders to ramp their shorts back up again, and in a hurry. The chart above looks at the level of how net short the commercials are as a group, and there can also be useful information in looking at how rapidly they are changing that position. This next chart looks at a 3-week change in the commercials net position:

When the commercial traders are in a big rush to either add to their shorts or pare them, this 3-week change indicator gets to an extended reading. High readings like we are seeing right now are pretty reliable markers of important price tops for silver.
How much of a price decline might unfold is not something which these data can tell us. We just know from the positions held by the smart money traders that they are betting big (and urgently) on a price decline. At the point when they start changing that position, lightening up on their shorts in a big way, then we might conclude that the decline is done, but that should be several weeks from now, based on how silver prices have responded in the past.
Tom McClellan
Editor, The McClellan Market Report
Apr 22, 2011
Visualizing the Gold-Silver Relationship |
Oct 30, 2015
COT Data For Gold At Topworthy Level |
Aug 31, 2017
GLD Assets Spike Higher |