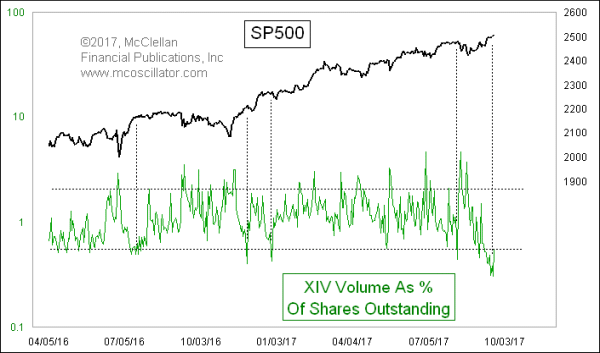
XIV Volume Showing Sign of a Price Top

Free Chart In Focus email
Delivered to you every week
The short VIX trade has been described recently as “the most crowded trade” out there. But traders of XIV, an inverse VIX ETN, have not been all that excited about it lately, judging by the trading volume. And that says we have a topping condition for prices.
XIV invests in the two nearest month VIX futures contracts, so it is not a pure inverse VIX product. The VIX futures sometimes behave a little bit differently from the spot VIX Index, and so anyone trading XIV should understand what they are getting into.
XIV has also become a darling of some investors because it usually benefits from the premium built into the price of VIX futures. As the near month contract gets close to expiration, XIV starts rolling its holdings to the contract 3 months out, which is usually at a higher price. Because it is shorting the VIX futures, a roll that involves covering a short at a low price and reentering a new short at a higher price typically works out to the benefit of the shareholders. By the same token, the long VIX futures ETN VXX typically suffers from that roll.
When the SP500 starts doing exciting things, interest naturally perks up in trading market related ETFs and ETNs, and XIV is no exception. But when we see volume drop in XIV, that is a sign of investor complacency, and it usually marks a meaningful top for the stock market.
Because the interest in trading XIV has grown greatly in the years since 2010 when it was introduced, I like to adjust the trading volume to reflect it as a percentage of the total number of shares outstanding. That is what this week’s chart shows, and the amazing thing is that values above 1.0 in this chart reflect days on which trading volume is equal to or greater than the entire float!
But when this measure of volume gets down to a comparatively low level, like what we are seeing just recently, it says that the urgency which traders are feeling about trading this ETN is at a lull. That turns out to be a decent indicator of a price top. It is worth noting that the most recent low volume reading (as a % of total shares outstanding) is the lowest since December 2015, just before the nearly 10% drop in the SP500 in January 2016 (just off of the left margin of the chart).
The point to take from this is that we don’t know what sort of top this signal is telling us about, just that a drying up of trading volume has been a pretty reliable sign of some kind of short term top. And we should not be surprised to see such a message, in the period of annual seasonal weakness which lasts into October. Time for caution.
Tom McClellan
Editor, The McClellan Market Report
Sep 10, 2015
VIX Above All of Its Futures Contracts |
Jun 15, 2017
Correlation Between VIX and SP500 |
Jun 02, 2017
When Not To Go Short Volatility |