The Market is Almost Never “Normal”

Free Chart In Focus email
Delivered to you every week
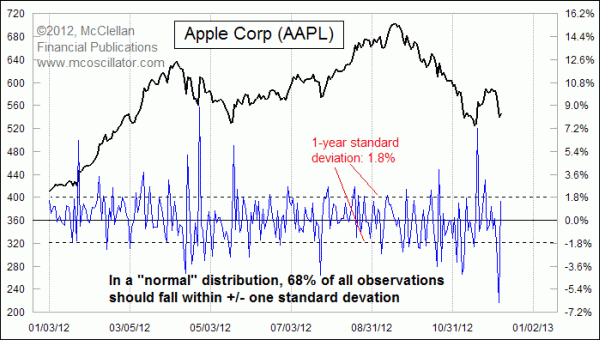
The share price of Apple Corp surprised a lot of people this week with a one-day drop of 37 points, or -6.43%. Part of why that was a surprise is that over the past year, the standard deviation of Apple's daily price change has been 1.8%, and so this was a down move which was greater than 3 standard deviations.
Those who have taken a course in statistics may recall "The 68-95-99.7% Rule". Simply stated, the rule indicates that for a normal distribution:
- 68% of all observations should fall within 1 standard deviation of the mean
- 95% of all observations should fall within 2 standard deviations of the mean
- 99.7% of all observations should fall within 3 standard deviations of the mean
So if Apple's daily share price change followed the rules for a "normal" distribution, and if one were to know that the standard deviation of daily returns is 1.8%, then there should be a 99.7% chance that any single day's change would be within +5.4% and -5.4%. Saying it another way, there should be only a 0.3% chance of a daily percent change being greater than 5.4% up or down. That's roughly one instance out of every 333 times, and so in a year with only 252 trading days, it should almost never happen.
But just in 2012, we have already seen 5 different days when Apple's share price rose or fell by more than 5.4%, something which the whole notion of a "normal" distribution says just should not happen. This is just one example of what some market analysts are referring to when they talk about the concept of "fat tails".
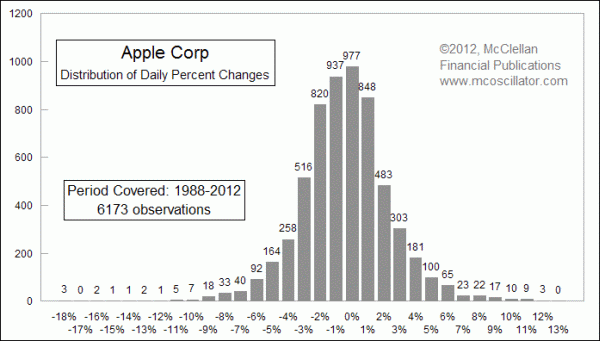
The "tails" of a bell curve distribution should see diminishing numbers of observations the farther you get away from the mean value. But when a distribution has "fat tails", that means there are more observations than theory would suggest out near the tails. To help see what that means for Apple's share price movements, here is a chart showing where they have fallen over the past 24 years:

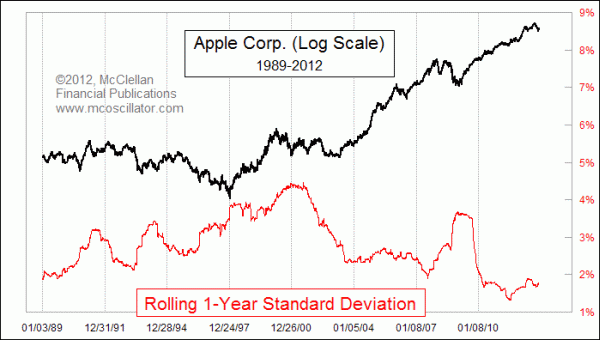
What we find is a whole lot of observations well outside of that standard deviation value of 1.8% that I mentioned above. Standard deviation of daily returns is often used as a measure of the inherent volatility of a stock price or other data, but as most traders know, volatility is not constant. And that leads to the final point, which is that the figure for the 1-year standard deviation of daily price changes varies dramatically over time.

Since 1988, Apple's 1-year standard deviation has been as low as 1.3% and as high as 4.5%. In fact, the past 3 years when Apple's product innovations have brought so much of a big gain in its shares has seen unusually low volatility in comparison to the rest of its history. And if Apple is starting to transition into a corrective period as the comparison to RCA's share price pattern suggests is coming, then we can figure on volatility increasing, and on having big up and down days becoming much more common occurrences. We have been updating that comparison of Apple's share price now to RCA's price pattern from the 1920s and 1930s with subscribers to our twice monthly McClellan Market Report and our Daily Edition.
Tom McClellan
Editor, The McClellan Market Report
Nov 08, 2012
Apple Walking In RCA’s Footsteps |
Aug 06, 2010
Correlations May Not Be What They Seem |
Nov 29, 2012
Why Increased Revenues Won’t Solve Fiscal Cliff |