ETF Float As A Sentiment Indicator

Free Chart In Focus email
Delivered to you every week
For years we have used mutual fund assets at Rydex and other fund families as a sentiment indicator. The proliferation of ETFs has had a big effect on the old-fashioned style of mutual funds, but it brings along with it the opportunity to look at investor sentiment in a whole new way.
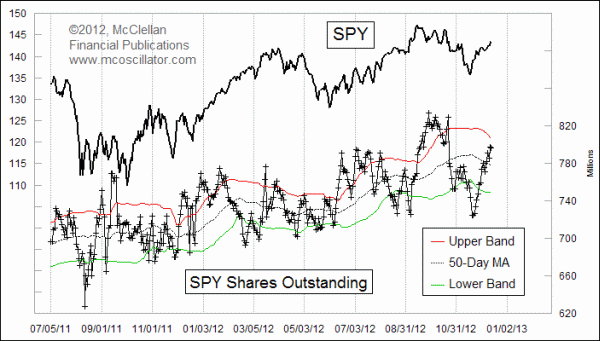
This week's chart looks at a comparison between the share price of SPY, the leading ETF tied to the SP500 Index, and the total number of shares outstanding. That latter number vacillates with investor mood, waxing and waning as the level of the SP500 goes up or down.
The way that ETFs work is that when more investors want to own shares, they bid up the share price and it goes above the net asset value (NAV) of the ETF's holdings. When that happens, the sponsoring firm issues more shares and thereby helps to drive the share price back down closer to the NAV. When investors throw up their hands and wail in fear, selling their ETF shares in quantities exceeding the market demand, then the sponsoring firm redeems shares and nudges the share price back toward the NAV. So the number of shares outstanding can be used as a gauge of investor interest in the stock market, especially for the bigger ETFs like SPY which command the greatest interest.
But one big problem is that there are no static measures of where "high" and "low" are for ETF share levels. We can only make inferences about that from looking at outstanding share levels on a relative basis. To help in that effort, I have added 50-1 Bollinger Bands to the chart above, so that we can see how excursions above or below those limits are associated with meaningful tops and bottoms for stock prices.
The 5.7% rise in the share price of SPY since the Nov. 15 bottom has brought about an almost equal rise of 5.6% in SPY shares outstanding. Thus far, the shares outstanding has not yet poked its head up above the upper 50-1 Bollinger Band, but it is getting very close. The 50-1 identification convention means that use a 50-day simple moving average of outstanding shares. Then the upper and lower bands are each set one standard deviation above and below that moving average. Most charting software programs default to a standard 20-2 convention, but I find that the 50-1 convention works well for a lot of sentiment related indicators, including the VIX. It seems to work nicely for SPY shares outstanding, as this week's chart shows.
You can track this data yourself by going each day to the SPDR web site and recording the published value each day for total shares outstanding. That's kind of a big pain, and so if you are a subscriber to eSignal or QCharts, you can access the data under the symbol $SPY.SO.
In just a few more days, the upper band will have dipped lower, and the number of shares outstanding may have popped up higher by enough to move above the upper 50-1 Bollinger Band, giving an overbought condition befitting a meaningful top.
Tom McClellan
Editor, The McClellan Market Report
Jan 27, 2012
Traders Like QQQ A Little Too Much |
Aug 12, 2011
Summer Gold Rush Pulls Money into Gold ETFs |
Apr 09, 2010
Rydex Assets Levels Show Investor Sentiment |