Uranium’s Bearish Message for Gold
Free Chart In Focus email
Delivered to you every week
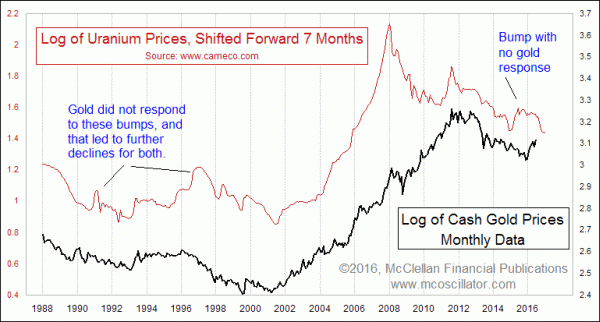
With the Brexit vote now decided, a lot of attention has turned to gold as a supposed “safety” asset. Most traders who lived through the big decline of 1980s do not think of gold as a “safe” asset. And the message of this week’s chart is that expectations for a big gold price rally from here may be misplaced.
A year ago, I wrote here about the role of uranium prices as a leading indication for what gold prices will do later. A 7-month lead time seems to be ideal for getting the best fit between the two plots.
The recent rise (since late 2015) in gold prices is a bit of a delayed reaction to the rise in uranium prices. But looking ahead from now, we can see that the recent drop in uranium prices is foretelling a drop in gold prices over about the next 6 months.
Gold can sometimes ignore uranium’s message, as we saw in 2009-2010 when gold trended higher in spite of uranium having trended downward. That was an adjustment process following uranium’s big spike up move in 2007, and uranium’s 2008-10 downtrend was a process of unwinding those excesses. So yes, there are exceptions to this model working perfectly.
Right now, we do not appear to have a bubble in uranium prices to suggest that something is amiss in the model. So I am expecting that gold should be able to stay with the program, and head downward into late 2016. Such a move would also fit well with the expectation from the 8-year cycle in gold prices.
Tom McClellan
Editor, The McClellan Market Report
Jun 04, 2015
Uranium and Gold, Part II |
May 19, 2016
Major Cycle Low Upcoming in Gold |
Dec 03, 2015
Gold Sentiment Washout |