Brexit Vote Brings a 10-1 Down Volume Day

Free Chart In Focus email
Delivered to you every week
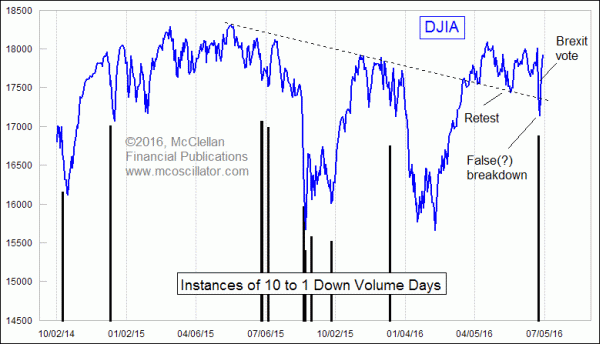
The panic over the surprise outcome in the British referendum over leaving the European Union brought about a fairly rare market event: a 10-1 down volume day. That means the amount of share volume in the stocks that were down that day (down volume) exceeded the up volume by more than a factor of 10.
We have only had 8 of these 10-1 down volume days in the past year, all associated with exhaustive selloffs. I say “associated with”, because the day of the 10-1 down volume reading is not always the final bottom day, and indeed that was the case this time. We saw the 10-1 down volume on Friday, June 24, but then stock prices declined for another day on Monday, June 27, before starting the big rebound.
So the key point to take away is that these events are markers of an exhaustive short term bottom, but not necessarily the signal that the bottom is all done happening.
10-1 down volume days can also be precursors of deeper trouble, and more volatility a few weeks later. We saw a pair of these days back in July 2015, ahead of the bigger problems that hit the market in late August 2015. Those July 10-1 down volume days did correctly say that a short term bottom was at hand, but the recovery was short-lived. A similar message came in December 2015, when a 10-1 down volume day marked a meaningful short term bottom, but hinted at trouble that arrived in January 2016.
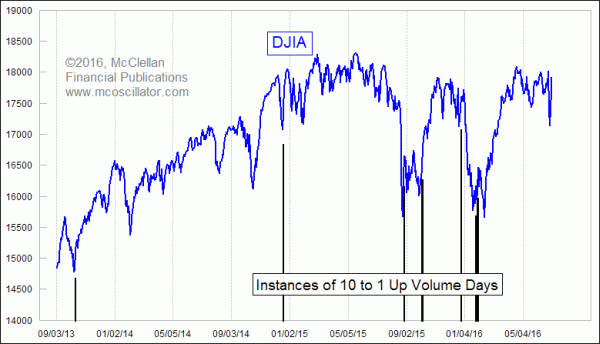
10-1 up volume days can also be important. But rather than signal exhaustion, they more often are seen at the beginning of a strong new uptrend, and they show strong upward initiation.

We did not get a 10-1 up volume day coming out of the post-Brexit selloff, but we did see 9.3 to 1 up volume on both June 29 and June 30, 2016. I have not done the testing to see if two 9-1 up volume days equals a 10-1 day.
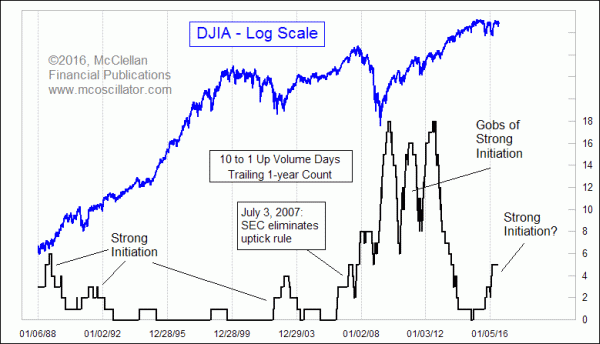
While a single 10-1 up volume day can provide momentary information about strong upward initiation, we can also gain insights from seeing a lot of them in a short amount of time. This next chart looks at a running count of how many 10-1 up volume days have occurred over the past year:

The key insight is that when we see several of them occurring within a year’s time, that tends to mark strong upward initiation for the stock market.
The one caveat is that this indication got thrown for a loop back in 2007 when the Securities and Exchange Commission (SEC) eliminated the “uptick rule” for shorting stocks. Prior to that change, a trader could only enter a short trade if the last price change in a stock was a move upward, but the rule was increasingly difficult to implement and enforce with higher trading volumes and faster trade executions.
Implementing that rule change brought a whole lot more market volatility for a while, and arguably exacerbated the severity of the selloff in 2008. It inarguably was followed by a big rise in both 10-1 up volume days and 10-1 down volume days in 2008. Then the Fed’s QE programs added a whole bunch of new liquidity to the financial markets, causing upward surges and a lot of these 10-1 up volume days.
As QE went away, the trailing one-year count of 10-1 up volume days eventually petered out to zero by late 2014. But now they are starting to appear again, which is a signal that we are seeing the early signs of strong initiation to get out of these sideways doldrums. This is a similar signal to what appeared coming out of the bear markets of 1990, 2002, and 2008. We may still have to wait a few weeks or months before that strong initiation results in actual new highs for the major indices, but the portent is bullish for an uptrend starting later this year and lasting through 2017.
Tom McClellan
Editor, The McClellan Market Report
May 13, 2016
Strong Summation Index Promises Higher Highs |
Apr 07, 2016
Eurodollar COT Throws a Curveball |
Mar 19, 2010
10 to 1 Up Volume Shows Initiation |