VIX Is Not Confirming Higher Prices

Free Chart In Focus email
Delivered to you every week
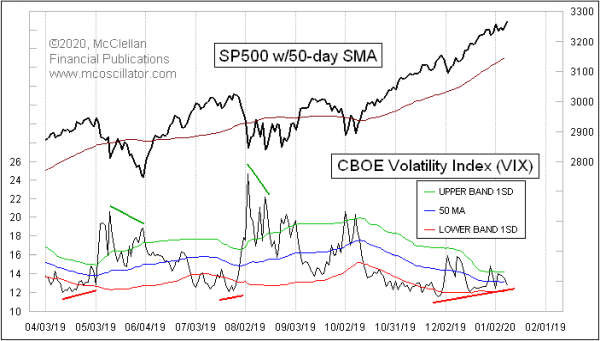
The major averages are ignoring missile strikes, oil market turmoil, and excessively bullish sentiment, keeping prices marching higher in 2020. But we have a major bearish divergence now in the VIX Index, which is NOT making lower lows to confirm those higher price highs.
The VIX Index made its lowest closing low for this price uptrend back on Nov. 26, at 11.54. Since then, it has been making a succession of higher lows, even though prices have continued higher. That sort of bearish divergence has meant a meaningful top was looming, based on past episodes. In my long look back at this relationship, I find that the VIX does not always give us a divergence like this at every top where we might like to get such a message. But when it does show us a divergence like this, it is worth listening to. And typically the time span of the divergences that matter is only a few weeks. Once we get a big VIX spike up toward 20 or higher, the clock gets reset in terms of tabulating a new divergence.
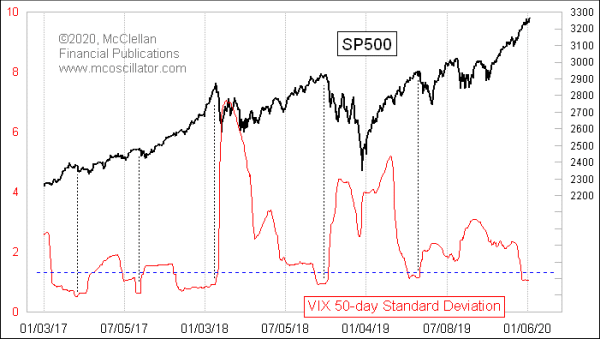
Even though the VIX is showing a slight upward cant, it has still remained pretty quiet. This next chart shows a 50-day standard deviation of closing VIX values:

The generally quiet VIX Index readings over the past 50 trading days has produced a very low reading for this indicator. Such readings are reliably associated with meaningful price tops.
The problem is that this is a condition, and not a “signal”. The low readings can continue for a long time before they finally are allowed to matter. So a condition like this helps to inform us about what is coming, but it does not say when the final price top moment will get here. Having said that, the moment when this VIX standard deviation starts to rise rapidly is a good tell that the price top is already in. But that tell usually comes via a big spike up in the VIX Index itself.
Tom McClellan
Editor, The McClellan Market Report
Jun 17, 2011
VIX Rate of Change More Important Than Its Level |
Sep 29, 2016
VIX Well Below Its Futures Contracts |
Feb 23, 2018
Volatility and Interest Rates |