SPY Number of Shares Outstanding Continuing to Rise

Free Chart In Focus email
Delivered to you every week
Note: This article previously appeared in the Jan. 14, 2020 issue of our Daily Edition. The charts are updated through Jan. 16’s data.
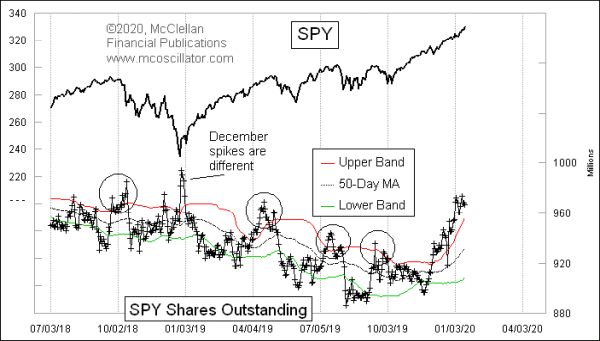
This week’s chart shows an interesting representation of bullish trader sentiment. The number of SPY shares outstanding is above its upper 50-1 Bollinger Band, and continuing to rise.
Check out the other instances when this indicator has gone above that upper 50-1 band. You will notice that all of them in this chart except one were associated with meaningful tops leading to noticeable corrections.
The number of shares outstanding in big ETFs like SPY and QQQ will fluctuate with investor interest. When more people want to buy into the market, they bid up the price of SPY which triggers the sponsoring firm (State Street Global Advisors) to issue more shares to get the share price nudged back as close as possible to the net asset value. That results in more shares outstanding, and the firm invests the cash it receives in more of the underlying stocks.
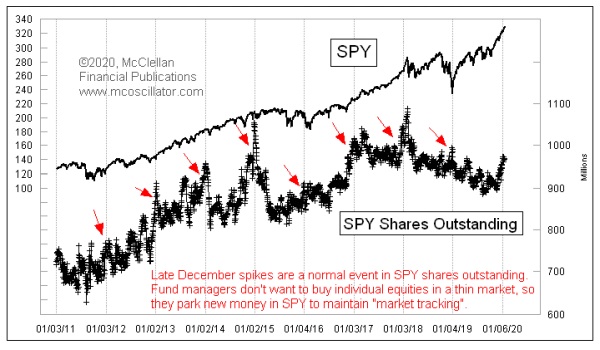
So seeing excessive or scant interest in owning SPY can be a proxy for trader sentiment. But there is a big caveat to this, which is related to that one exception shown in this chart. The principle does not work in late December, because of something that big portfolios do.
Around Christmastime, trading volume in the stock market generally dries up. A big mutual fund or other portfolio which gets in new money to invest does not necessarily want to put that money to work by buying more shares of its preferred list of holdings, since that would adversely affect prices in the thin trading environment. So they maintain “market tracking” by other means, by either using stock index futures or by trading ETFs like SPY.

That results in a regularly occurring spike in SPY shares outstanding every December, which is unrelated to investor sentiment. And then usually that gets unwound in January, as the funds sell SPY and go back to their regular holdings. That is why the low readings in Jan. 2019 were not a sign of a price bottom, but rather a symptom of that unwinding.
We are not seeing an unwinding now in January 2020, which makes the high reading for shares outstanding all the more remarkable as a sentiment indication.
Tom McClellan
Editor, The McClellan Market Report
Jul 22, 2016
SPY Shares Outstanding Showing Topping Condition |
Feb 18, 2016
VXX Shares Outstanding Data Work Differently |
Feb 05, 2015
Pessimism Evident in QQQ Shares Outstanding |