2-Year Yield and Fed Funds Finally in Balance
Free Chart In Focus email
Delivered to you every week
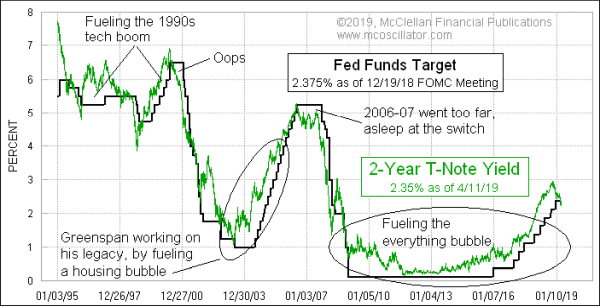
I have long advocated for the FOMC getting out of the business of setting short term interest rates, and instead they should outsource that job to the 2-year T-Note yield. While that outsourcing might put several American PhD economists out of work, I’m okay with that, because it would give us the benefit of having more efficient monetary policy, with less severe bubbles and depressions.
This week’s chart compares the Fed Funds target rate (black line) to the 2-year T-Note yield (green). When the green line is above the black line, that means the Fed is setting the Fed Funds (FF) target rate too low, and that is a condition which tends to be very stimulative to the financial markets. Impending depressions are signaled when the 2-year drops well below the FF, and the Fed is slow to respond to that. So if the Fed really wanted to dampen down the excessive stimulus and restriction, then the FOMC Policy should be to keep the FF as close as possible to the 2-year yield all the time.
This next chart helps to make this point about stimulus and restriction. It compares the spread between the 2-year and the FF rates to the NYSE’s A-D Line, which is one of the best indicators of financial market liquidity.
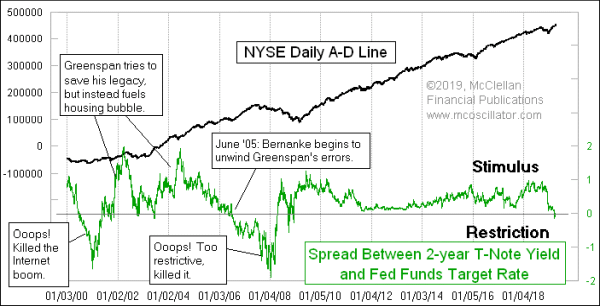
Generally speaking, when the spread is positive, that is enormously stimulative to the stock market, and eventually to the economy. A downward excursion into the “restriction” zone is what creates problems. But those problems do not necessarily have to commence upon the first foray into that “restriction” zone.
In the middle of the chart, we can see that this spread first went negative in May 2006, but the bull market continued for another 17 months before the liquidity problems finally became a problem. The NYSE’s A-D Line topped in June 2007, and price indices made their final top in October 2007.
And back in 2000, this spread went negative for the first time in June 2000, which was after the Nasdaq’s bubble top, but before the real ugliness of the bear market which resulted from that Internet Bubble collapse.
Getting back to the neutral point between stimulus and restriction means that the Fed is finally transitioning to a neutral state with monetary policy. That could be just a waypoint en route to a restrictive policy. If the 2-year T-Note yield continues to fall, and if the FF target rate does not respond in kind, then that could similarly make for problems several months from now.
But if the Fed can somehow manage to keep their target close to where it should be, then perhaps we can finally get to enjoy that Goldilocks economy so many have dreamed of. I don’t hold out much hope that the Fed will get that right, because I don’t believe any of the FOMC members are actually going to read this. Or if they do, they are not likely to believe that “the market” could know more than they do, what with their fancy degrees and all. But there is always hope for a better outcome someday.
Tom McClellan
Editor, The McClellan Market Report
Feb 26, 2015
2-Year T-Note Shows Path For FOMC |
Apr 13, 2018
Fed is Behind, But Still Screwing Up |
Mar 12, 2010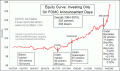
FOMC Announcement Days Tend To Close Up |