Big Rise Coming in Food Prices

Free Chart In Focus email
Delivered to you every week
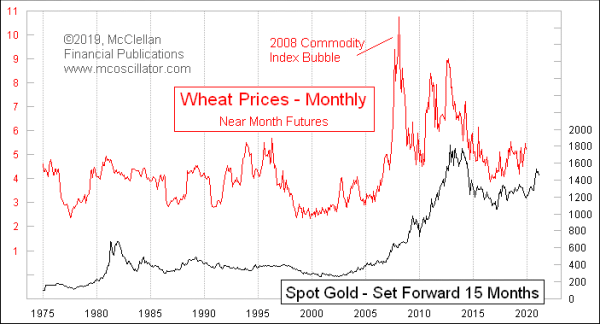
Food prices are poised to see their biggest rise in several years, and not just because China is going to become a buyer again of U.S. agricultural goods. There is a different reason for expecting food prices to rise, and it is contained in this week’s lead chart.
Gold prices act as a leading indication for lots of different things, and this chart shows how the movements of wheat futures prices tend to echo gold’s dance steps, with about a 15-month lag period. Gold was making a bottom in the $1100s 15 months ago, and so now we are at that echo point. The rise in gold since that Sep. 2018 bottom should bring a corresponding rise in grain prices.
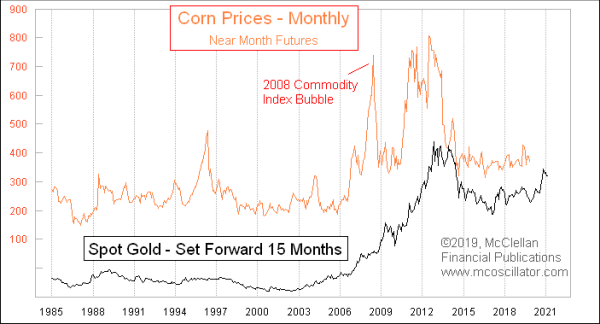
This effect appears not only in wheat prices, but elsewhere in the grain markets. Here is the same comparison with corn:

The magnitudes of the movements in gold do not always get accurately matched in the movements of grain prices. That is especially true when exogenous events like the 2008 bubble in commodities prices generally took the grain markets off track a little bit. That event passed, and the correlation was restored. The point about these comparisons is that gold seems to get the timing of the turning points right, even if the magnitude is a little bit different.
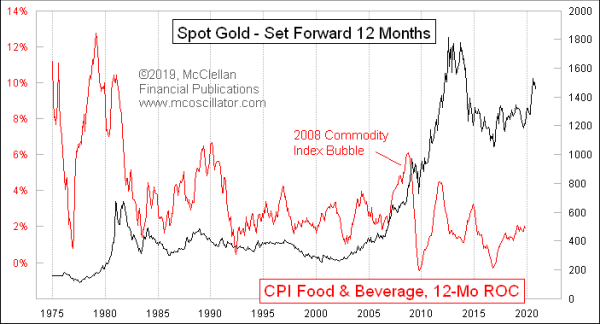
Wheat and corn are not the only commodities which we eat, but they have a big influence on lots of other types of prices. So the message from gold’s leading indication can also be applied more generally to food prices broadly. Here is a comparison to the annual growth rate in the CPI Food and Beverages sub-series.

Note that in this case, the lag time shrinks just a little bit to 12 months instead of 15 months for wheat and gold. Changes in the raw commodities prices take some time to flow through into food prices at the grocery store, which is where the CPI tabulators take their measurements. This measure of food prices dipped to a negative growth rate in late 2016, a year after the Nov. 2015 bottom in gold prices. Now we are at an inflection point related to gold’s more minor bottom in Sep. 2018. The steepness of gold’s rise out of that bottom suggests that we should see a pretty exciting rise for food prices in 2020.
Don’t look for the financial and economics media to get the attribution right about this, though. They won’t believe that such an up move can be known about in advance. They will assuredly instead blame it on actions by the Trump administration, or the Chinese tariffs, or some other more tangible factor which they know how to think about. But now you will know different.
Tom McClellan
Editor, The McClellan Market Report
Aug 17, 2017
Warm Temperatures Mean Lower Inflation, To a Point |
Nov 22, 2019
Squeeze Is Building in Industrial Metals |
Jul 06, 2015
Gold Shows Real Reason for Oil’s Dip |