Bund Spread’s Message for the Stock Market

Free Chart In Focus email
Delivered to you every week
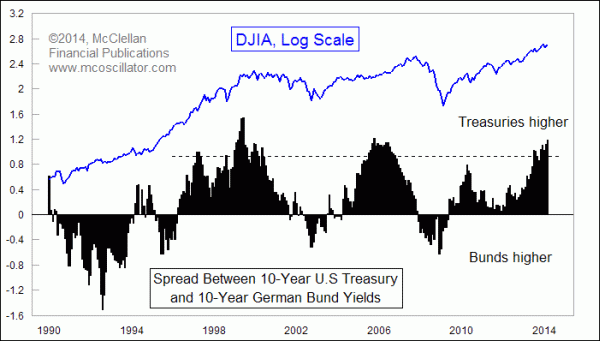
The folks who watch international bond yields have been giving a lot of attention lately to the fact that the spread between the 10-year U.S Treasury Note and the equivalent government bond from Germany is now up to its widest point since 2005. CNBC's Rick Santelli showed a chart of it in a segment on April 2, 2014, and what caught my eye was how much that yield spread looked like the behavior of the stock market.
So I downloaded the data on German yields from the St. Louis Fed, calculated the spread versus the 10-year T-Note, and put it on a chart with the DJIA as shown above. And sure enough there is a nice correlation there.
The German bonds are known in the bond industry as "bunds", derived from the German prefix "Bundes" which means "federal", as in the Bundesrepublik Deutschland, or the Federal Republic of Germany in English.
As noted above, the T-Note to Bund spread was just slightly higher in 2005, and also back in 1999, and both instances were associated with toppy conditions for the U.S. stock market. If I were to try and craft a "rule" about this relationship, then I would say it gives a pretty good top signal for the stock market when it rises up above about 100 basis points (1 percentage point), and then turns down.
That turning down part is important, because the spread can keep on rising as stock prices keep on rising. Only after the spread starts turning down does it seem to matter for stock prices, and with some degree of lag.
Why would this work? I confess I have been struggling with that ever since seeing Santelli's chart of just the spread on the air. What I have come up with is that the spread is actually a measure of investors' risk-seeking behavior. When investors are fearful about the stock market, then the "flight to quality" mentality sends them into Treasury bonds and notes. In such instances, people forget about fair values and just want the perceived greater safety of having the assurance that the U.S. government will guarantee their investment. That pushes down T-Note yields.
At the other end of the sentiment extreme, when investors are confident about the stock market, they get out of Treasuries so that they can invest in stocks, and that exit from Treasuries helps push bond prices down, and yields up.
Because of the Germans' reputation for an almost religious devotion to low inflation, their bond yields can be thought of as more of a baseline value for gauging worldwide inflation expectations. And so to the degree that U.S. T-Note yields are varying from that baseline, there is information in this yield spread about investors' appetites for risk, or the lack thereof.
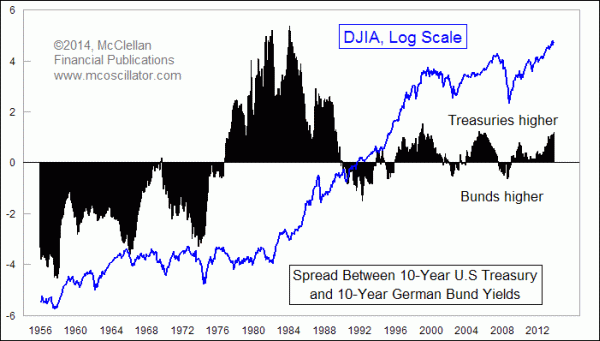
But it is really interesting to note that the relationship has only been working this way for about the last 25 years. Here is a longer term look at the T-Note to bund spread:

The data on bund yields goes back to 1956, a period when post-war West Germany was still working to rebuild everything, including its financial markets. During the 1950s and 1960s, the divided Germany was still more like an emerging market than the established industrial power it is today. So bond traders back then understandably demanded a higher yield for investing in West Germany's debt.
That relationship flipped wildly to the other side in the mid-1970s, when ultra-high inflation in the U.S. pushed Treasury yields up to a high level, taking this spread up to as high as 536 basis points in 1984. German reunification in 1989-90, and the eventual creation of the euro currency in 1999, helped to bring this spread to a more stable relationship that we see today.
Right now, the still-rising spread means that risk-seeking (or safety-avoiding) behavior is still on the rise. And why not, with the Fed still giving away free money at the short term end of the maturity spectrum. But at some point in the future, the amount of this spread implies that we are going to have to see a 2001-03 or 2008-09 style bear market, just to restore equilibrium in both the international bond markets and the U.S. stock market.
On an unrelated topic, the St. Louis Fed's web site is a great source for accessing a huge variety of historical economic data. They even have the DJIA back to 1896, and other stock market index data series. But an announcement on their site says that Standard & Poors is about to yank away their authority to publish S&P index data after April 25, 2014. So if you want to have a chance to access and download that data before it goes away, now is the time to act.
Tom McClellan
Editor, The McClellan Market Report
Feb 20, 2014
Yield Curve’s Message For GDP |
Jan 30, 2014
Yield Spread Model Calls For 2014 Stock Market Low |
Nov 21, 2013
Perhaps The Only Chart That Matters (For Now) |