Friday Is A Better Indicator Than Monday

Free Chart In Focus email
Delivered to you every week
The stock market seemed to have a positive reaction to Federal Reserve Chairman Ben Bernanke's comments on Friday, August 31, at the Fed's Jackson Hole conference. But the positive reaction may have had more to do with the fact that it was a Friday than with anything he might have said (or not said).
In terms of being an indicator of sentiment, the market's behavior on Fridays can tell us a lot more than its behavior on any other day of the week. The biggest reason is that investors who go long or stay long on a Friday have to accept 2 or 3 days of "event risk", knowing that they cannot get out of those positions if something goes bad somewhere in the world. That was a lot bigger deal back during the Arab Spring, or other major geopolitical events, than it has been lately. So to see the market close up more or less on Fridays can be a sign that investors are getting more or less confident.
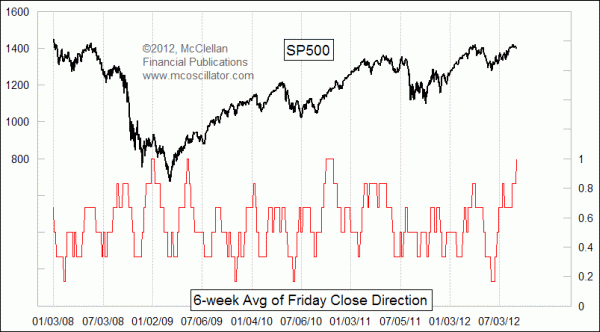
The positive reaction on August 31, 2012 makes it now 6 Fridays in a row that the SP500 has closed higher. This is reflected in this week's chart, with an indicator that gives an up Friday a value of 1, or a down Friday a value of zero. Then I just run a 6-week moving average to show what the recent tendency has been.
Very low readings in this indicator are pretty reliable indications of bottom-worthy bearish sentiment. Interestingly, we have not seen 6 down Fridays in a row since 2006, so "low" has to be interpreted in a relative way. For the past few years, it has been very rare to get this indicator even down to 1 out of 6, but they have been good bottom indications when they did happen.
Very high readings tend to mark tops, but they can also occur at the beginning of a strong new uptrend. So they are less reliable as a sentiment indication than very low readings. Interestingly, there was a string of 13 straight up Fridays for the DJIA back in 2007 that finally ended in June 2007. For what it is worth, the SP500 did not share in that string because there were a couple of tiny down days for the SP500 then which were up days for the DJIA that year.
The last time that this indicator got up to 100% was back in 2010, coming out of the bottom which followed that year's Flash Crash decline. Rather than being a topping indication, that high reading showed strong upward initiation (thanks to QE2).
A 100% reading back in May 2009 also showed strong upward initiation, although the market did also pause there for a couple of months to rest from the rapid start of that new uptrend.
So what does this week's 100% reading mean? We'll find out for sure in a few weeks, but our leading indication from the eurodollar Commitment of Traders data is calling for a big top just after the election in November. We have been featuring that leading indication quite frequently for subscribers to our twice monthly McClellan Market Report newsletter and Daily Edition. So seeing a potentially top-worthy sentiment indication arrive a couple months ahead of that top feels a lot like that string of 13 up Fridays that we saw back in 2007, ahead of the final top in October 2007.
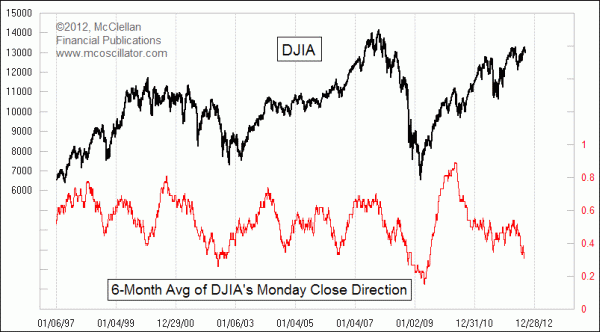
Interestingly, the other days of the week do not show such good reliability in this way as sentiment indicators. They just do not correlate as well with the intermediate term up and down swings in the stock market. The market's direction on Mondays in particular appear to be more of a statement about the underlying trend of the market than of investor sentiment.

The indicator in this chart takes a longer term look at how the market behaves on Mondays, looking back over 6 months instead of 6 weeks. What this reveals is that the way the market behaves on Mondays mostly just matches the overall trend of the market. This makes sense, because in an uptrend there will be more up days than down days, so any particular Monday would be more likely to see a higher close if there are more of them to go around.
So bottom line, if Fridays are down too much, that's a bottoming indication. If Fridays are up a lot like they have been lately, it is a sign that it may be time for the wise trader to start worrying, because other people are not.
Tom McClellan
Editor, The McClellan Market Report
Feb 03, 2012
Eurodollar COT Indication Calls For Big Stock Market Top Now |
May 04, 2012
A Seasonal Quandary |
Sep 30, 2011
First Day of the Month Effect |