Total Dollar Volume Not So Bad
Free Chart In Focus email
Delivered to you every week
I got a call this week from CNBC reporter Bob Pisani, wanting to know about the total dollar volume of stock trading. He has noted that share volume has been declining for several years, after peaking back in 2007-08, and that has a lot of traders on Wall Street lamenting the loss in commission revenue. Those fees are based on share volume, and so when share volume goes down, trading fees fall off, and Wall Street is unhappy.
Bob Pisani and others have noticed that there are a lot more high priced stocks now than there used to be, and so he wondered if volume measured on a dollar volume basis is really declining like share volume is. Fortunately, we have the data to provide an answer to that question. You can read Bob's blog posting on this topic here.
On January 2, 2009, the median share price of all NYSE-listed and traded issues was $14.50/share. Now that figure has jumped to $23.48, a jump of 62%. So a trade made with the same amount of money now would involve fewer shares, on average.
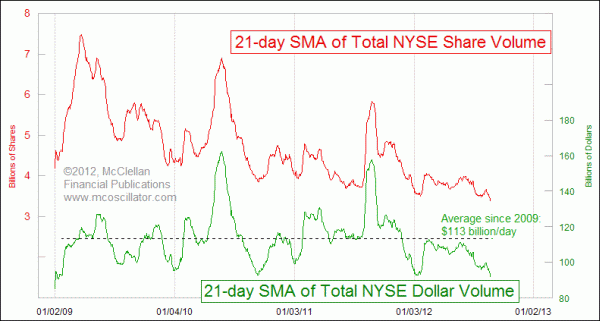
This week's chart shows a comparison of dollar volume versus share volume for all of the stocks traded on the NYSE. I calculate dollar volume by looking at each stock's share volume total for each day, and multiplying it by the closing price. This is not quite perfectly accurate, since many of the actual trades will be at a price other than the closing price. But it is a fairly good way to get an approximation.
Because there is a lot of daily variation in the volume numbers, I have smoothed each series with a 21-day simple moving average (21SMA). There are usually about 21 trading days in a month, so this smoothing looks at what the volume numbers have been doing over the preceding month.
Looking at volume in this way allows us to see that while total share volume has indeed been in a long gradual decline, the dollar volume has remained pretty steady. It has normal seasonal fluctuations, with volume typically diminishing in August and December as many traders are focused on their vacation and holiday activities.
The current 21SMA reading for total dollar volume is below the long term average of $113 billion per day, but not much different from what we saw during the summer volume dips of 2009 and 2010. August 2011 saw a spike in both measurements of volume instead of the normal seasonal slowdown, thanks to the financial crisis in Europe that summer.
It is not surprising that volume tends to increase during market price declines. People get more excited by price damage, and thus more incentivized to get active with their trading. When volatility wanes, so does trading volume.
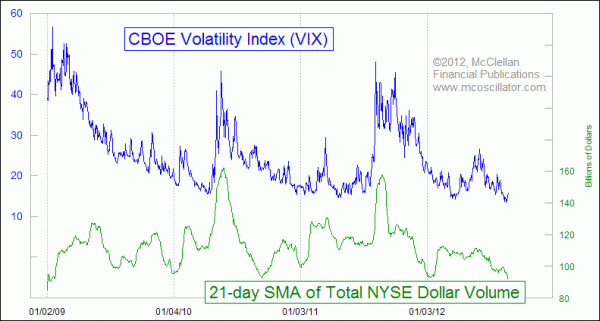
This next chart shows that same plot of total dollar volume, this time compared to the CBOE Volatility Index (VIX). Not surprisingly, the two series are very well correlated. So the people on Wall Street who want volume numbers to go back up should be careful what they ask for.
With more publicly traded companies embracing the idea of letting their share prices continue to rise, as Google and Apple have recently made more fashionable, we can expect this trend to continue. If we ever get back to seeing companies engage in stock splits to make their share prices seem more affordable, then share volumes can start to rise again. But if splitting a stock price just serves to help Wall Street collect more trading fees, and if it provides no other utility for the companies who list their shares, then why would they split? If that remains the choice that companies face, then we can expect this trend to continue with declining share volume, even if total dollar volume stays the same.
Tom McClellan
Editor, The McClellan Market Report
Aug 20, 2010
Disagreement Between A-D and Volume Lines |
Mar 19, 2010
10 to 1 Up Volume Shows Initiation |
Apr 20, 2012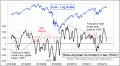
Summation Index Promises Higher Highs After Correction Ends |