Gold Moving Lower Despite Covid-19

Free Chart In Focus email
Delivered to you every week
Gold futures fell $52/oz on Thursday, March 12, the same day that stock prices fell 10% and everyone is worried about catching Covid-19. How can that be, since gold is supposed to be a “rainy day investment”?
The answer in part is that people buy gold in case of a rainy day event. But when the rainy day gets here, people sell gold so that they can get money to buy actual things.
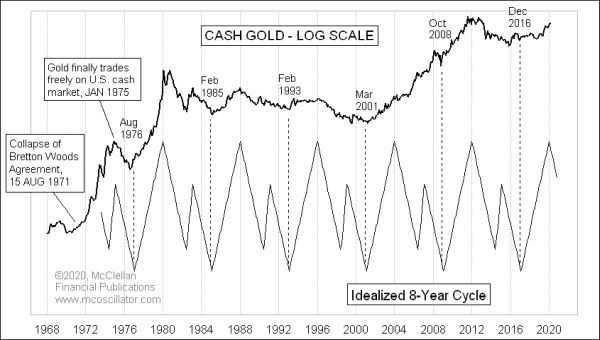
Gold prices should start trending down now, and for the next 5 years, according to this week’s chart. I noticed several years ago that there is an interesting 8-year cycle evident in gold prices. It is a rather unusual looking cycle, as depicted by the idealized pattern shown in the chart.
I created that pattern back in 2003, based on how gold prices had behaved from the 1970s through the 1990s, and I have just extended it from then to the current day. It has worked pretty well over that period, although I have to concede that gold prices had a much more bullish version of it during the 2000s.
The pattern involves a 3-year up wave, and then a 3-step five year down wave. The pattern shows that the latest 3-year up wave is supposed to have peaked in January 2020, and so February’s closing high of 1609.85 is pretty close to being on time for that schedule. Now we are into the 5-year declining phase, which should take gold prices generally lower until early 2025. As noted in the chart, there is some variability about when those 8-year bottoms tend to arrive. It is ideally due in early 2025, but based on past variability it could come in anywhere from August 2024 to March 2025, and still be considered “on time”.
The mere idea of a 5-year bear market for gold seems counterintuitive, given that we have negative real interest rates, and a world economy thrust suddenly into turmoil by Covid-19 and the Russia-Saudi oil games. But this cycle has been working pretty darned well ever since shortly after gold first started freely trading in 1975. So it is tough to discount.
Tom McClellan
Editor, The McClellan Market Report
Feb 13, 2020
Crude Oil’s Drop Was Foretold by Gold |
Dec 27, 2019
Gold COT Data Call for More of a Drop |
Dec 29, 2017
Gold’s 8-year Cycle |