VIX Rise Overdone, But Part of Enduring Trend

Free Chart In Focus email
Delivered to you every week
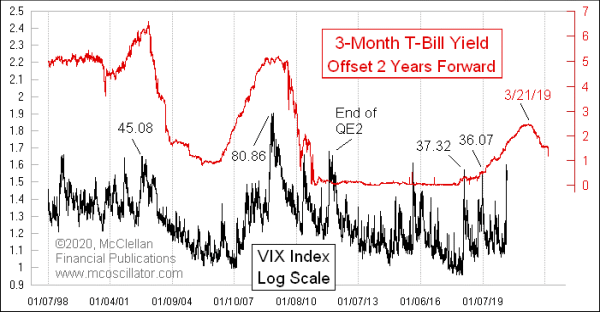
The market has put on a big VIX Index spike in early 2020, thanks to worries about the novel corona virus and the 2020 election. While the immediate spike is overdone in the short term, it is also part of a larger uptrend in the VIX which is due to last until March 2021.
This week’s chart is one I have shown before, and it compares a log-scaled VIX Index to the 3-month T-Bill yield. The key trick is that the T-Bill yield plot is shifted forward by 2 years to reveal how the VIX tends to follow in the same footsteps, after that lag time. The caveat is that the VIX tends to follow in those footsteps a whole lot more loudly. In simpler terms, the VIX is more “noisy” than the interest rate model which leads the VIX’s movements.
There are lots of ways to deal with noisy data. We can smooth it out with all sorts of mathematical processes, from simple moving averages all the way up to modern signal processing functions. Or we can visually and mentally accept that the VIX data are noisier and make our own mental adjustment. Neither methodology is perfect. In the realm of stock market analysis, “perfect” is elusive, and just getting an edge that is useful is something great.
The rise in T-Bill yields which was taking place leading up to the March 2019 top is now getting echoed in an uptrending set of values for the VIX Index. That process is not yet complete, and it won’t be complete until March 2021. The current rapidly falling T-Bill yields are going to mean lower VIX Index readings, but that process won’t begin until a year from now. The corona virus induced spike up to above 40 is an overdoing of the up move which short term rates have been calling for. So that overdoing will need to be addressed by having the market undo some of the overdoing.
The larger message is that we can expect generally higher VIX values between now and March 2021. After then, the VIX should start trending rapidly lower, but the momentary bits of excitement over the next 12 months leading up to that March 2021 top could bring even higher VIX Index values than what we have seen in this current episode.
Tom McClellan
Editor, The McClellan Market Report
Oct 24, 2019
Volumetility |
Jan 09, 2020
VIX Is Not Confirming Higher Prices |
Jul 27, 2017
How VIX Ends A Long Run of Low Values |