Gold Repeats A Prior Pattern

Free Chart In Focus email
Delivered to you every week
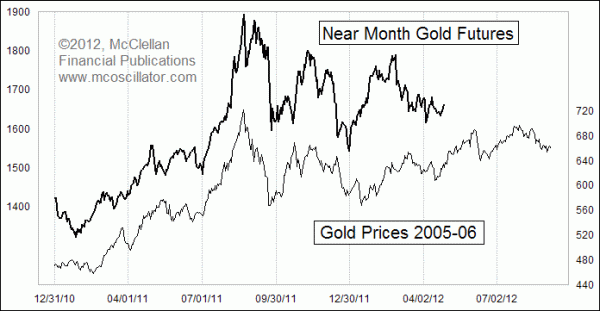
I like to get the answers ahead of time, and one of the fun ways to do this is with price pattern analogs. This is a technique that employs examining a price pattern from the past, and finding that it matches up more or less with what's happening now. The implication is that if the correlation is good up until now, it should continue to be good into the future.
The example this week compares the current price structure of gold prices to what gold was doing back in 2005-06. You can see that it is not a perfect correlation, much like if Shaquille O'Neal tried to dance the Charleston like Fred Astaire. One might be able to detect that it was the Charleston, but the two men would clearly have different dance styles. So it goes with price pattern analogs.
Analysts who use price pattern analogs like this have a variety of different ways of hunting for them. I tend to be more visual, recognizing patterns that I think I have seen before, and then putting them together on a chart to verify that the relationship really is what I think I am seeing. Some people like to let the computer do the work of sniffing out correlations, comparing a current market price pattern to all possible prior patterns to see which delivers the best number for a correlation coefficient. That can be tricky, because trending moves can cause a phenomenon in the data known as "auto-correlation" which can skew the numbers.
In my experience, the durability and legitimacy of a price pattern analog will tend to work better if there is a common theme for both periods. So for example, if we were to look at the stock market in 2012 and compare it to other presidential election years, the common theme would be election year behavior. That should make past election years a good place to start hunting for similar patterns, just as an example of finding common themes.
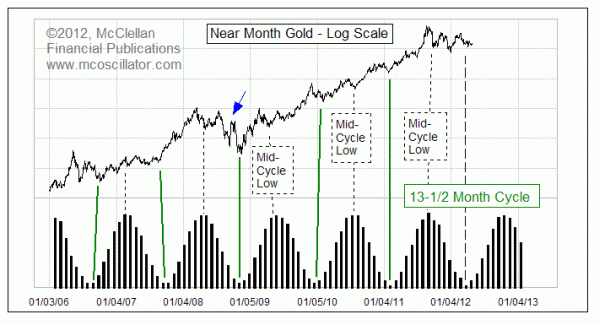
For this week's chart of gold, the common theme is the 13-1/2 month cycle in gold prices. My research has found that this is the dominant long term cycle affecting gold prices. I write about it quite frequently in our twice monthly McClellan Market Report newsletter.
For the pattern analog comparison above, I have aligned the 2006 peak with the 2011 peak, each of which occurred at roughly the same point in that 13-1/2 month cycle. The 2006 peak is visible at the left end of this chart:

We are now entering the initial upward phase of the next iteration of this cycle, which is a period when big gains for gold prices are typically seen. A few months from now, we'll get to worry about just how this cycle's important mid-cycle low might have an effect on gold prices, but that is not the issue to be concerned with at this time. Instead, we want to locate the true major cycle bottom in gold prices, which can arrive a month early or late and still be considered "on time" in the history of this cycle. We also want to catch the initial upward phase of the new cycle, which is when the biggest gains are usually seen.
Having the 2005-06 pattern as a guide can help us see where all the dance steps are from a complete prior instance, and let us see how the current market is following that rhythm. If the current gold market follows those same dance steps, then we should see a nice rise up into a top due in early June, followed by another rise leading to a slightly higher top in late July.
One additional point to understand about using price pattern analogs like this is that all analog relationship eventual fail and break correlation. They are great fun while they last, but they eventually break up, and usually at the moment when you are most counting upon them to work. So don't ever get married to the idea that an analog has to work exactly as you think. Analogs are an interesting phenomenon of market physics, and fun to use while they are working, but one should expect them to be fickle and not completely trustworthy.
Tom McClellan
Editor, The McClellan Market Report
Nov 18, 2011
One to Three Years Left For Gold’s Run |
Sep 22, 2011
1946 Analog Holds Key For Current Market |
Sep 09, 2011
Gold Price is a Measure of Dollar’s Debasement |