Gold’s Choppiness Index

Free Chart In Focus email
Delivered to you every week
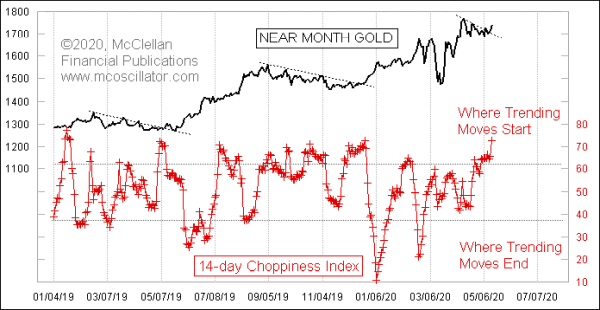
The 14-day Choppiness Index for gold prices is up to a really high level. The message of such a reading is that a new trending move should commence, but it does not tell us in which direction.
The Choppiness Index was created by Australian commodities trader E.W. Driess, as a way to quantify how linear (or not) the recent trend has been. It takes into account the size of the recent daily price ranges, as well has how far prices have moved over the lookback period. Here is the formula, in case you want to build it yourself:
Choppiness Index =
100 * LOG10(SUM(Range(1),n) / (MaxHigh(n) – MinLow(n))) / LOG10(n)
– n is the user-defined period length, 14 days in this example
– Range(1) is the Daily True Range (Period of 1), factoring in opening gaps
– SUM(Range(1), n) is the sum of the Daily True Range over past n periods
– MaxHigh(n) is the highest intraday high over the past n periods
– MinLow(n) is the lowest intraday low over the past n periods
A very low Choppiness Index means that the recent price trend has not been very choppy at all. Low readings tend to indicate that a period of choppy and trendless price behavior is about to commence.
A very high Choppiness Index means that prices have not really been going anywhere, just chopping sideways, and thus that a trending move is likely to commence. But it does not say in which direction, just that the choppiness should stop and a more linear move is afoot. It is left to the chartist to make a determination of whether a new trending move really is starting, and in which direction. It should be further noted that such a trending move is not required to start, just because you might notice that there is a high Choppiness Index number. It is an indication, not a guarantee.
Driess suggested that 62 was a good threshold for a “high” reading, and that 38 would mark a “low” reading. He must have been a Fibonacci buff.
Gold’s 14-day Choppiness Index has been at a high level for several days, and now finally appears to be mattering. Gold futures prices jumped 24 points on May 14, 2020, apparently signaling the start of the called-for trending move, in this case higher.
Tom McClellan
Editor, The McClellan Market Report
Mar 03, 2016
Gold Preps For New Trending Move |
Jun 19, 2014
Crude Oil Abnormally Quiet |
Jun 27, 2019
Gold’s Dollar-Price Breakout Started With A Yuan-Priced Breakout |