Investors Fleeing Out of SPY

Free Chart In Focus email
Delivered to you every week
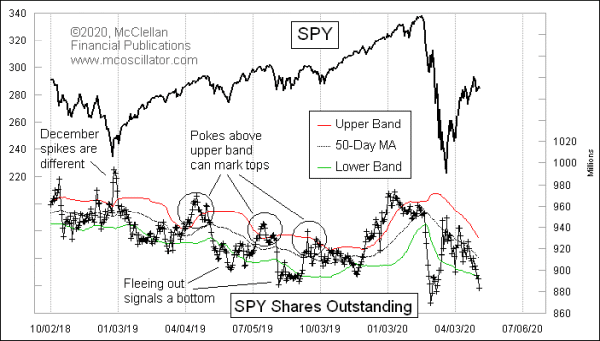
Stock prices have risen energetically off of the March 23 price low. At first there was a big surge of money pouring into SPY, the largest of the SP500 ETFs, and that lifted its number of shares outstanding. But as the rally has proceeded further, investors have started getting shy and pulling out of SPY, taking the number of shares outstanding to one of the lowest readings of the past few years.
In ETFs, unlike in common stocks, the numbers of shares outstanding will change up or down as investors are more or less interested in owning those funds. The sponsoring firm (State Street, in the case of SPY) will issue or redeem shares as needed in order to keep the share price close to the net asset value. In a big liquid ETF like SPY, that usually means the share price will be very close to the NAV. In smaller or less liquid ETFs, there can be wider spreads.
Looking at the number of shares outstanding can thus give us insights into investor sentiment. Usually the shares outstanding numbers will rise and fall along with prices. It is when such changes go too far that we get useful information.
I have found that it helps to add a set of 50-1 Bollinger Bands when looking at this and other sentiment data, such as the VIX Index. The “50-1” designation means that 50 days is the lookback period for both the center moving average and for the calculation of the standard deviation, and the bands are set 1 standard deviation above and below the 50MA. When the SPY shares outstanding number gets outside of the upper or lower bands, that signals an extended condition.
Getting extended does not mean that prices have to reverse right away. It is just one bit of information. And in December, that message can get screwy because year-end low volume leads a lot of portfolio managers to eschew buying the stocks that they would like, for fear of moving prices too much in an illiquid market. So to maintain “market tracking” for new money that comes in, they buy into SPY in late December, and then work their way back out of it and into their preferred list of stocks in January. That can bring some misleading readings in December, and so it is best not to get too excited about what the shares outstanding numbers do in that month.
Right now, we are seeing a peculiar circumstance where prices are rising, but the number of shares outstanding has fallen rapidly, dropping below the lower band. This conveys the message that investors are not believing in the uptrend, which of course is a sign familiar to every contrarian, that the uptrend should continue.
Tom McClellan
Editor, The McClellan Market Report
Jan 16, 2020
SPY Number of Shares Outstanding Continuing to Rise |
Dec 22, 2016
SPY Assets Zooming Higher |
Feb 05, 2015
Pessimism Evident in QQQ Shares Outstanding |