Investors Intelligence Data at Bearish Extreme

Free Chart In Focus email
Delivered to you every week
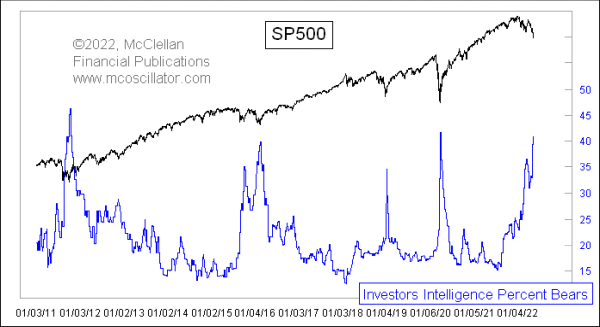
When prices go down, people turn more bearish. It is a natural human phenomenon, and it is still working during the current price decline. The useful aspect of this is that when you see an extreme reading for a sentiment indicator, it is a sign that a bottom is at hand for prices.
This week’s survey data from the folks at Investors Intelligence showed a big jump in the percentage of investment advisors and newsletter writers they track who are being tallied as bearish, up to 40.8% now. This is pretty rarified territory, only seen 3 other times in the past decade. Each of those were associated with pretty important price lows.
It has been bigger than this before. At the scariest point of the 2008 decline, the week of Oct. 3, 2008, it got all the way up to 53%. And in December 1994 it got all the way up to 59%. So it is possible to get this group to a greater bearish state than this, but it has been a long time since they have done that. It is worth noting that between then and now a lot of the old analysts have been replaced to some extent by a new group. So no such survey is ever exactly the same, just as you can never step in the same river twice.
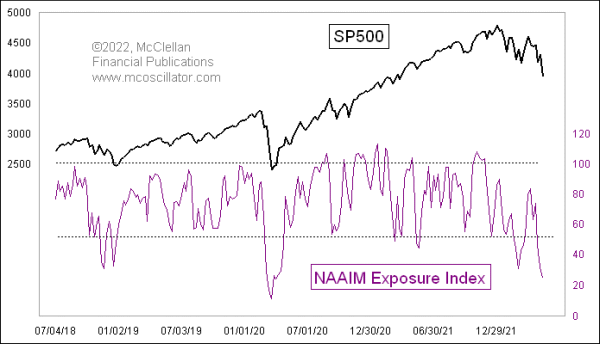
A similarly extreme sentiment reading comes from the NAAIM Exposure Index, which this week got down to 24.

This indicator reflects the average stock market exposure each week among the members of the National Association of Active Investment Managers (NAAIM). Their individual responses can range from -200 for leveraged short, to 0 for neutral, and up to +200 for leveraged long. Those responses are then averaged together to get the NAAIM Exposure Index. Even though these survey respondents are professional money managers, they still fall victim to the same moods and fears as everyone else.
The NAAIM Exposure Index went a little bit lower than this at the bottom of the Covid Crash in March 2020. Other than that, we have to reach all the way back to the twin price bottoms in September 2015 and February 2016, when investors got fearful in the illiquid period following the end of QE3.
In other words, the current sentiment condition in these indicators is in the same range as what was seen at some really meaningful price bottoms. A sentiment reading is a condition, and not a “signal”, and the one thing such a reading will not tell you is when it is going to finally matter. They all usually do, eventually, but it can be frustrating to wait for that moment to appear.
Tom McClellan
Editor, The McClellan Market Report
Feb 25, 2022
Investors Intelligence Data Nearing Parity |
Oct 30, 2014
Insights from Investors Intelligence Data |
Nov 06, 2014
More from Investors Intelligence Data |