The Bad Things That QT3 Will Bring
Free Chart In Focus email
Delivered to you every week
The Federal Reserve announced on May 4, 2022 that it would start to reduce its holdings of Treasury securities and mortgage-backed securities (MBS) beginning on June 1, 2022. Their plan is to sell off $30 billion of Treasuries and $17.5 billion of MBS every month from June through August. Then in September they plan to ramp up to double those amounts every month.
This will not be bullish at all for the stock market, based on our collective past experience with instances when the Fed has tried to do this before.
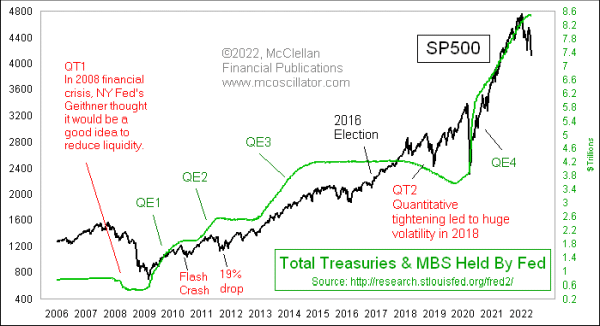
The first and perhaps most notorious instance of “quantitative tightening” or QT, was in 2008. For some reason, the Fed officials decided in late 2007 that it would be a good idea to start selling off its Treasury holdings, and it accelerated those sales in early 2008, arguably hastening the demise of Bear Stearns in March 2008. It did not turn out well.
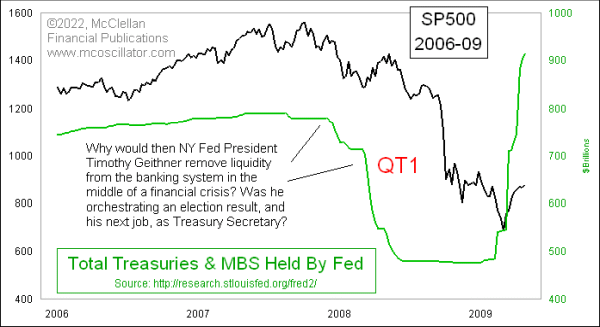
The removal of that liquidity helped to fuel the Great Financial Crisis of 2008 by taking away additional liquidity when liquidity was already being destroyed on its own by the collapse of the 2005-06 real estate bubble peak. And the pain for the stock market kept on going even after the Fed stopped selling in June 2008. The stock market kept suffering all the way until early 2009, when the Fed finally started QE1 and added some liquidity back to the system.
When the Fed ended QE1 in late 2009, it merely stopped buying Treasuries, and did not start selling them. And they kept on buying MBS for a few months. But that cessation of buying Treasuries was still enough of a liquidity shock that the stock market suffered the May 6-7, 2010 “Flash Crash”. The Fed responded to the illiquidity it had created by starting QE2 in August 2010, and everything was great again for the stock market.
That is until the Fed suddenly ended QE2 in June 2011, and the stock market underwent a 19% drop in July 2011. Once again, this was the result of just a cessation of Fed buying, and not any actual drawdown of their assets.
After QE2 was “Operation Twist”, an effort at yield curve control that did not really work out well in terms of accomplishing what the Fed wanted. So in late 2012, the Fed announced that it would start QE3, which once again worked great at lifting the stock market.
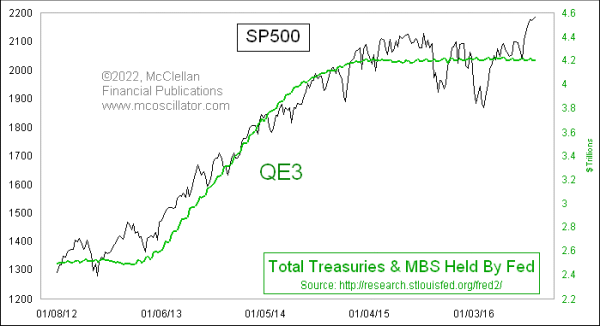
This time the Fed had learned its lesson about not shutting down QE all at once, and so they did a “taper” of the purchase rate. But that just put off the volatility associated with ending QE, and we saw some big swings for stock prices in August 2015 and January 2016.
By 2017, there was a new president in office who pushed through stimulative tax cuts immediately upon taking office. That gave the Fed some cover to start QT2, reducing its balance sheet by around $30 billion a month. But this pulling back of liquidity did still bring a lot of volatility in 2018, including the collapse of the short VIX trade in January 2018, and a very ugly decline in the fourth quarter of 2018.
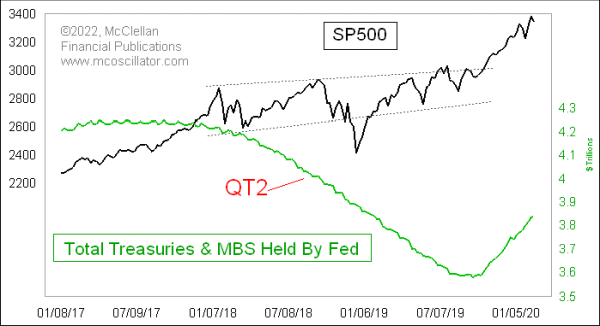
Stock prices were trapped going sideways until late 2019, when the Fed decided that it needed to start buying again, but we were all sternly instructed by Chairman Powell that this was “not QE”. It still had a QE-like effect on lifting stock prices, at least until the Covid shutdown of the economy by governmental fiat in February 2020.
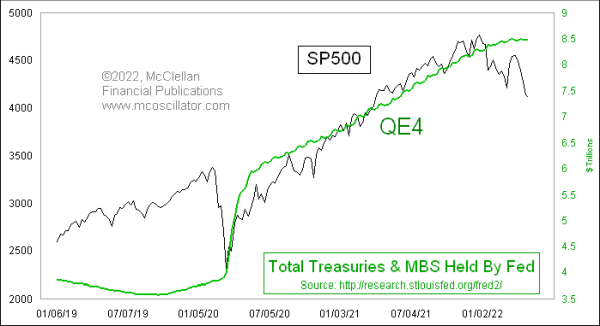
That hit to the economy led the Fed to accelerate its purchases, and the public was then allowed by the disinformation police to start calling it QE again. And once again, it had a wonderfully bullish effect on stock prices, that is until 2022 when the Fed told us it would be ending QE. Investors have seen this movie enough times before to know how it ends, and now the soon-to-commence sales of the Fed’s bond and MBS assets are also going to have their own predictable effect.
QT2 in 2017 was mitigated by a cut in income tax rates, which made up for the loss of Fed-supplied liquidity. There does not seem to be the prospect of a tax cut this time to mitigate what the Fed is about to do, even though taxes are already running at above 18% of GDP, which is the threshold for triggering a recession. See the linked article below.
The result is likely to be a 2008-style destruction of liquidity, at a time when the stock market is not prepared to handle that. Whether we get the same amount of damage that we got in 2008 is something that remains to be seen. But the outcome will not be good.
If I was put in charge at the Fed (which I thankfully am NOT), I would immediately reverse course on QT plans, since it has never worked out well. Just leave those assets in place, and replace them on the balance sheet as they mature. This would also mitigate the interest rate expense problem of the federal government, since the Fed returns the “profits” from those holdings to the Treasury.
And then I’d move the Fed Funds target rate up to match the 2-year T-Note yield.
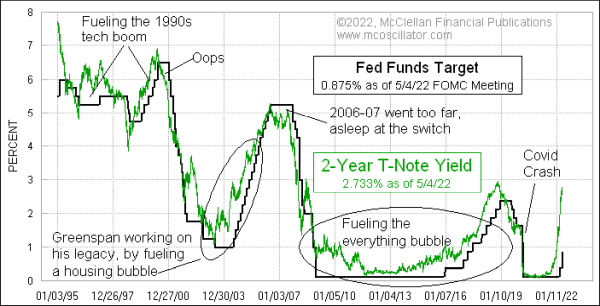
Fed rate-hiking cycles end when the Fed Funds target rate is finally allowed to meet where the 2-year T-Note yield has already gone. Putting that off just means that the misery lasts longer. When the Fed Funds rate is below the 2-year, it fuels economic bubbles. When it is above the 2-year, it fuels recessions.
In an ideal scenario, we would just get rid of the FOMC, and outsource interest rate policy to the 2-year T-Note yield. That would save a lot on travel costs for the FOMC members, and it would arguably get us a much better result.
Tom McClellan
Editor, The McClellan Market Report
Aug 05, 2021
Taxes Too Darned High, Retarding The Economy |
Sep 18, 2020
Is QE Good For Gold Prices? |
Mar 26, 2020
QE is Bullish for Stocks, Bearish for Bonds |