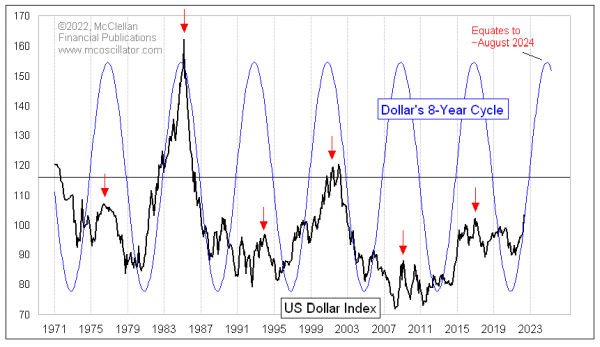
Dollar’s 8-year Cycle

Free Chart In Focus email
Delivered to you every week
The US Dollar Index is climbing up to its highest levels now since 2002, which is getting a lot of currency traders excited. U.S. manufacturers are a lot less excited, because a more valuable dollar makes it harder to sell products overseas.
This rise in the dollar is arriving despite the Fed being behind the curve on getting short term interest rates up to where they should be. Low interest rates mean you get less return for keeping your wealth parked in dollars. But everything is relative, and other currencies’ interest rates are not beating out the dollar in this regard.
There is an important 8-year cycle in both the dollar and in gold, as I have discussed previously here. We are currently in the ascending phase of the dollar’s 8-year cycle, which should mean a continuing rise until a top ideally due in around August 2024. But don’t fall into the trap of thinking that it will be a uniform uptrend. The dollar’s actual movements are a lot messier than this pretty sine wave implies.
What I also see in the chart above is that the dollar tops every other cycle seem to be more significant. That would imply a 16-year cycle, of which the 8-year period is a half-cycle harmonic. The big dollar tops were in 1985, 2001, and 2017. This current cycle would be the weaker type, assuming that this pattern continues.
And that is a tough assumption to hang a lot of assumptions on. The dollar has really only been freely traded since 1971, when President Nixon abandoned the Bretton Woods accords and allowed the dollar to float. Before then it had been relatively fixed by international agreements, and any cyclical behavior would have been crushed by that governmental action. So we cannot really know what this cycle would have been like before 1971.
For now, it is fair to note that the Dollar Index seems to be in a strong uptrend, and that this is occurring right on schedule. How far it goes in price terms is not something that this time cycle will tell us.
Tom McClellan
Editor, The McClellan Market Report
Jul 02, 2021
Gold and Dollar Share an 8-Year Cycle Period |
Dec 29, 2017
Gold’s 8-year Cycle |
Mar 04, 2022
Flattening Phase of Yield Curve Cycle |