It’s the Fed, Yanking The Punchbowl

Free Chart In Focus email
Delivered to you every week
We were having a perfectly nice low-volatility uptrend until Jan. 26, and everyone was happy. Since then, the inverse VIX ETN known as XIV has blown up (a great case of a “burning LOH” marker), and traders are starting to remember that stock prices actually can go down. So why now?
As with most bear markets and recessions, the blame goes to the Federal Reserve, which decided last year that it would start unwinding all of the QE buying of T-Bonds and Mortgage Backed Securities (MBS) that it had bought up from 2009-14. Last year, the Federal Reserve under Janet Yellen announced plans to start liquidating those bond and MBS holdings, starting at a rate of $10 billion per month in Q4 of 2017, and ramping up that rate by an additional $10 billion in every quarter to follow. So the target rate of sales for Q1 2018 is $20 billion per month, and it is supposed to ramp up to $30 billion per month in Q2, then $40 billion per month in Q3, eventually peaking at a $50 billion per month rate in Q4 and beyond.
Selling bonds into the open market means that the banking system has to give up “money” to pay the Fed for the bonds and MBS that the Fed is selling. I’m not going to get into a discussion about the various definitions of “money”, and how it is all just a ledger exercise. But it is clear that the selling of bonds by the Fed reduces the amount of liquidity in the banking system, which has effects on the ability of stock prices to remain at lofty levels. And it probably does not help to have the Treasury Department doing its own bond sales at a higher rate.
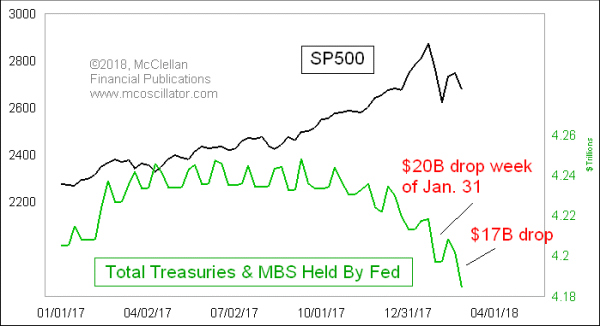
The stock market is not taking this well, which should not be a surprise. Part of the market’s indigestion may come from the lumpy way that the Fed’s balance sheet is changing. It is not a smooth, gentle glide path, but rather a sawtooth pattern which tends to introduce turbulence into the banking system. That turbulence flows through into stock prices, as we are seeing.
These amounts might seem like they should be inconsequential, especially for a stock market which trades $100-200 billion of stock every day. But the top chart shows that the Fed’s actions do seem to matter, and the drops in the Fed’s balance sheet are coinciding with the big weekly drops for stock prices.
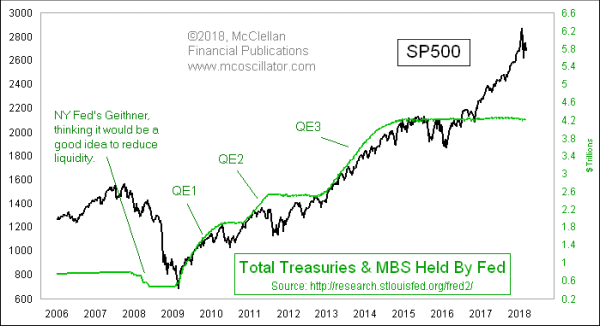
Even at this higher rate of bond sales, the Fed still has a long way to go to unwind its balance sheet, which at its peak stood at $4.25 trillion worth of T-Bonds and MBS. In this larger chart, one can barely even detect the reductions which have taken place thus far:

But we can see how stimulative to stock prices it was to have had QE1, 2, and 3. And each time those were just stopped, the market ran into an illiquidity problem. The May 2010 Flash Crash followed the cessation of QE1. When QE2 was stopped in June 2011, we got a 19% decline in July 2011.
The Fed ended QE3 more slowly, “tapering” the size of its bond and MBS purchases very gradually before ending them completely in late 2014, but we still got the China minicrash in August 2015, and an aftershock in January 2016. Those events all arose not from any actual unwinding of bond holdings, but just from stopping the buying.
It is illustrative to look back to 2007-08, when the Fed actually did a series of T-Bond sales. Under the leadership of the then-president of the New York Fed, Timothy Geithner, the Fed reduced its holdings of T-Bonds from a high of $791 billion in August 2007 to a low of $475 billion in March 2009. It is a bit of a mystery exactly why the Fed thought it was a good idea to sell bonds and take money out of the banking system during the worst liquidity crisis in decades. But that 2007-09 bear market did help secure the election of President Obama, who then appointed NY Fed President Geithner as his Treasury Secretary, so you can insert your own conspiracy theory here.
My expectation for 2018 is that the officials at the Federal Reserve are eventually going to realize that their proposed accelerating rate of bond sales is having an adverse effect, and they will alter their course. But they are not going to realize that for a while, and so stock investors are in for a much wilder ride in 2018 than what they have become accustomed to.
Tom McClellan
Editor, The McClellan Market Report
Sep 22, 2016
Bond Market Knows What Fed Should Do |
Feb 14, 2013
Fed’s POMOs Keep Market Aloft |
May 11, 2012
Is JPM “The Burning LOH”? |