Rainbow Convergence Has Predictive Value

Free Chart In Focus email
Delivered to you every week
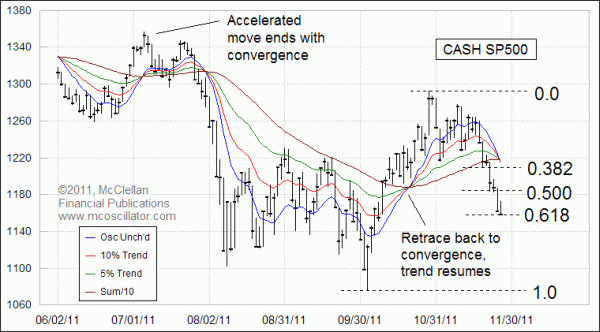
In the spot SP500 Index chart right now, there are a lot of things going on simultaneously. On the way down from the Oct. 27 top, the SP500 stopped briefly at the 0.382 retracement level, and paused there for an extra day. Then it dropped through and made its next stop at the 0.500 retracement level, again pausing there for a day.
The big drop on the day before Thanksgiving made it almost to the 0.618. That precise level is at 1158.00, and the intraday low on Nov. 25 was 1158.66 . So is Black Friday's small range just another manifestation of the "pause for a day" Fibonacci effect?
Probably not. Also going on right now is that we are seeing a completion of the "rainbow convergence" shown in this chart. That name comes from all of the pretty colors of the moving average type lines. A rainbow convergence is a similar event to Dave Landry's "bowtie crossover", and other moving average crossover events that others have written about.
This week's chart uses our own preferred mix of moving average type lines, and this style of chart is featured frequently in our Daily Edition. You can read about the definitions and calculations of each of those four lines here, but the focus today is on making an interpretation of their meaning rather than in getting bogged down discussing the math.
In our understanding of rainbow convergences, the meaning of a particular convergence event depends on how prices are behaving when the convergence takes place. When prices make a short term accelerated move which brings the four lines together, then the moment of the convergence usually marks the end of that move. What follows next is a pause for a few days, as prices decide whether to resume the move or reverse it for good. Usually that decision process involves a test of the Price Oscillator Unchanged line, which represents the level at which a close would turn our Price Oscillator precisely sideways.
A good example of this is the July 2011 top. A sharp up move ended when the four lines converged. In the days that followed that top, the SP500 was not able to successfully find support at the Price Oscillator Unchanged line, and the market eventually broke down in a big way.
If, on the other hand, prices retrace back toward the price-time point of an impending convergence before it is done, then what usually follows is a resumption of the preceding trend. We saw an example of that type of behavior in mid-October, when the new uptrend interrupted itself briefly to dip back toward the convergence, and then the uptrend resumed.
So now here in November 2011, we are seeing the Thanksgiving week selloff take the SP500 down to its 0.618 retracement level, and simultaneously completing a rainbow convergence with this accelerated short term move. Because we have seen no retracement back toward this convergence, that means that we should expect to see at least a pause in the down move, while prices decide what to do next. In the days ahead, if we see prices rally up to the Price Oscillator Unchanged line and fail to move above it, then we can expect more downward movement. But if the SP500 can instead get up above that line, and turn the Price Oscillator up in the process, then we'll know that this rainbow convergence will have marked a bottom for the down move, and the strength we saw in October can have a chance to reassert itself.
For those who are new to seeing our work, this sort of analysis is regularly featured in our Daily Edition. Check out the samples posted here, and see if it is something you would be interested in reading on a daily basis.
I invite you to also check out the 72-minute video of a recent presentation I did before the Seattle Securities Traders Association.
Tom McClellan
Editor, The McClellan Market Report
Oct 21, 2011
McClellan Oscillator Confirms New Uptrend |
Aug 19, 2011
Death Cross Does Not Live Up To Its Hype |
Jul 08, 2011
Using the 10% Trend By Itself |