


Treasury-Bund Spread Rising Is Bullish
Free Chart In Focus email
Delivered to you every week
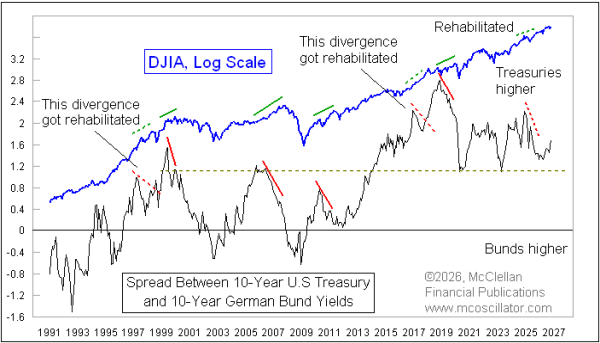
A year ago I noted here that there was a divergence in effect between stock prices and the Treasury-Bund spread. That divergence has since been rehabilitated, and the spread is now rising which is a bullish condition.
The Treasury-Bund spread I am referring to is the difference between the current 10-year yield on US T-Notes versus the equivalent 10-year German sovereign debt instrument. Ever since German reunification in October 1990, there has been a very strong correlation between this yield spread and the behavior of US stock prices. Interestingly, this relationship did not work before that reunification.
More important than their correlation is the behavior of seeing divergences between the Treasury-Bund spread and prices ahead of big price declines. That has been an effective warning sign of trouble. But it is also one that is prone to false signals at times. The apparent divergence in 2025 was an example of that.
By seeing this spread rising now, we not only have no divergence but we also have an affirmative bullish sign for the stock market. At some point this spread could top out and give a different message, but that would take a few months to develop.
Tom McClellan
Editor, The McClellan Market Report
Oct 09, 2025
Treasury-Bund Divergence |
Jun 13, 2018
Treasury-Bund Spread Just Gave Stocks New Life |
Oct 13, 2017
Treasury-Bund Spread Says Dollar Has More Room to Fall |