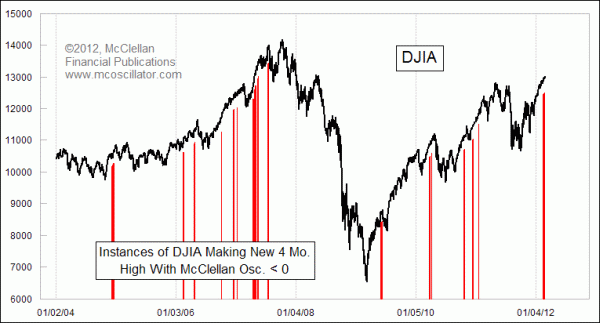
DJIA At Higher Highs with Negative McClellan Oscillator
Free Chart In Focus email
Delivered to you every week
The McClellan Oscillator went below zero back on Feb. 14, and has remained negative ever since. But that has not stopped the major averages from moving up to new multi-year highs.
Having the Oscillator drop below zero can sometimes be seen as a "sell signal", but it depends on what else is happening in the market. It is certainly not a positive factor to have higher price highs appear while the Oscillator refuses to confirm that strength.
You can see in this week's chart that some of the instances of a higher price high with a negative Oscillator reading have marked really important tops. Other times, though, these instances have not stopped the market's advance. So like the Hindenburg Omen, this occurrence serves as a warning of trouble, but not a guarantee that a top is in.
The McClellan Oscillator can be thought of as an accelerometer for the Advance-Decline statistics. So a negative McClellan Oscillator means that the A-D numbers have been undergoing a downward acceleration. That can mean actually turning downward, or just going up more slowly.
To help visualize how this works, this next chart shows the two exponential moving averages (EMAs) that are used to calculate the McClellan Oscillator. We call them the 10% Trend and 5% Trend because that was the original naming convention of P.N. Haurlan, who introduced their use for tracking stock prices back in the 1960s. The rest of the world seems to prefer to call them a 19-day and 39-day EMA, but we're sticking with the original terminology.
Read more about McClellan Oscillator calculation here.
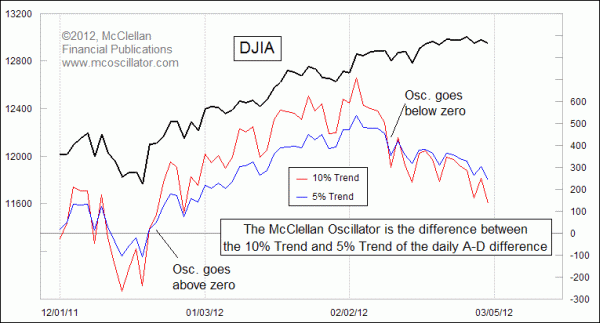
When the 10% Trend is above the 5% Trend, the McClellan Oscillator will be positive. In recent days, the 10% Trend has been below the 5% Trend, so the Oscillator is negative even though both of these EMAs are still above zero. Given where these EMAs are right now, the market will have to produce some really big positive daily breadth numbers (A-D) to get the Oscillator back above zero. The reason is that the high positive A-D difference would pull both EMAs higher, and so it has to be enough higher to pull the faster 10% Trend up above the 5% Trend.
It is much easier to get the Oscillator to turn positive once both of these EMAs have been pulled down into neutral or negative territory.
Seeing the price indices make higher highs with the McClellan Oscillator down below zero says that the former pace of the price advance is not being sustained. It is like a Mercury rocket which has run out of fuel but is still rising, and the slowing pace of the rise is a precursor to splashing back down in the ocean.
You can watch the Oscillator level each day and see a chart at our Market Breadth Data page.
Tom McClellan
Editor, The McClellan Market Report
Jan 13, 2012
RASI Above +500 Says Bull Market Not Done |
Oct 21, 2011
McClellan Oscillator Confirms New Uptrend |
Jul 08, 2011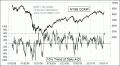
Using the 10% Trend By Itself |