Investors Intelligence Bull-Bear Spread
Free Chart In Focus email
Delivered to you every week
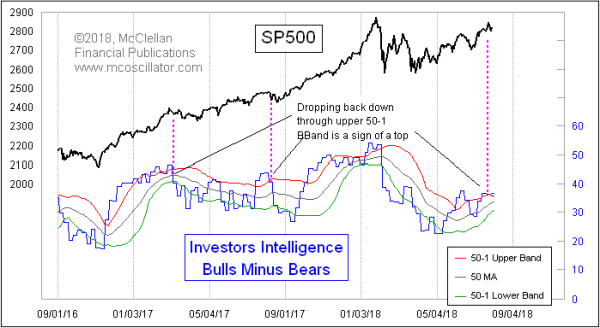
We saw a really high degree of bullishness back in January 2018, when the U.S. stock market was making a big blowoff top. Since then, the major averages have struggled to move higher, and so has bullish sentiment. But in July 2018, we saw the Investors Intelligence Bull-Bear Spread move up again above its upper 50-1 Bollinger Band (BBand).
That is a clue that sentiment is getting too far extended, but it is not enough by itself to say that the market is all done going up. What is needed is a crossing back below the upper 50-1 BBand to say that a top is at hand. And while this is a useful indication, it is far from being a perfect one.
The “50-1” Bollinger Band designation means that I am using a 50-day lookback period for both the centered moving average and for the standard deviation. The upper and lower bands are set 1 standard deviation above and below that centered 50-day moving average. Most software programs use a 20-2 setting as the standard for Bollinger Bands, but I have found that 50 days and 1 standard deviation is a useful pairing for sentiment indications.
And for the Investors Intelligence numbers, the 50-1 Bollinger Bands provide an interesting additional bit of information. Going above the upper band says that the investment advisors and newsletter writers tracked by Investors Intelligence are getting more bullish, which is an interesting development. But dropping back below that upper band is the key insight.
A drop back below that upper 50-1 BBand is often (but not always) a sign of an intermediate term top for stock prices. The latest data from Investors Intelligence are showing a slight decline in the percentage who are “bulls”, and that means the bull-bear spread has dropped back below the upper band. The message here is that we are seeing an intermediate term (i.e. over a few weeks) top for prices, the outcome of which should be a meaningful decline for stock prices.
Our other work on liquidity, cycles, and seasonality suggests that a bottom in late August to mid-September is the most likely end point for such a presumptive decline that the Investors Intelligence data are describing.
Tom McClellan
Editor, The McClellan Market Report
Feb 09, 2018
Big Change In Bull-Bear Spread |
Nov 06, 2014
More from Investors Intelligence Data |
Oct 30, 2014
Insights from Investors Intelligence Data |