Overbought McClellan Oscillator

Free Chart In Focus email
Delivered to you every week
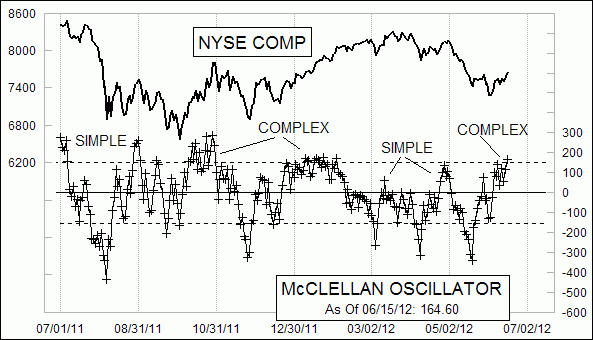
As of June 15, 2012, the NYSE's McClellan A-D Oscillator has risen up to an overbought level. But not all overbought conditions are created equal. There is context to be found in the way that it is done.
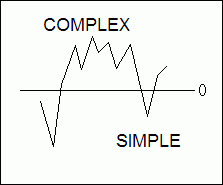
There is a rule that we use when interpreting the Oscillator's structure: The complex side is the strong side. What I am referring to is a complex structure that is entirely above or below zero, with lots of chopping up and down but without a crossing of the zero line. When you see that, the message is that whichever side of zero it is forming on is the side that is in control. So a choppy complex structure above zero means that the bulls are in charge, whereas a complex structure below zero means that the bears are in charge.
A "simple" Oscillator structure is one where you see it move across the zero line and then turn straight around without building any complexity. Such a structure says that there is no control of the market by the side on which the simple structure forms.
So  let's say, for example, that you see a complex structure above zero that gets interrupted by a quick dip below zero and then right back up again. The message would be that the bulls are in charge, even though the bears were able to put on a temporary disruption. In this example, the bulls should be presumed to still have control once the bears get done with their little dip.
If you see a description of the McClellan Oscillator on some other web sites, quite often it will refer to it as being overbought or oversold at some numerical level. This is an overly simplistic way of looking at what the Oscillator has to tell us. When my parents, Sherman and Marian McClellan, wrote their booklet Patterns For Profit in 1970, one of the big points that they addressed was that the pattern and structure of both the McClellan Oscillator and the McClellan Summation Index matter far more than just their mere numerical level.
The strong breadth numbers on the NYSE have produced a reading of +164.60 on June 15, 2012. That is above the +150 level that has been marking an overbought threshold in recent years, and thus it indicates an overbought condition. But at the same time, it also signals strong upward initiation for this new price uptrend. It does that because this overbought reading occurs within a complex structure above zero, which is a statement that the bulls are in charge.
Compare it, for example, to the peak at +263 on Aug. 31, 2011, visible at the left end of this week's chart. The Oscillator rose straight up into that peak, and came straight down to back below zero, never forming any complex structure while it was above zero. That was a statement that the bulls then were able to mount a big countertrend pop, but were not organized enough yet to start a sustained uptrend. The Oscillator then chopped back and forth across zero for the month of September 2011, with neither side taking charge.
That changed after the price bottom on Oct. 3, 2011, when the Oscillator finally started building a complex structure above zero to say that the bulls were in charge. And the bulls were furthermore able to demonstrate sustainable strength by posting a nice high reading well above +150.
By understanding the messages from simple and complex McClellan Oscillator structures, a chartist can get important information about who is in charge of the trend, the bulls or the bears. Seeing a complex structure above zero right now says that the bulls are in charge, and seeing it get up to well above +150 says that they are initiating a strong uptrend which should continue beyond this current overbought reading. This week's chart is updated and made available every day at our Market Breadth Data page.
Tom McClellan
Editor, The McClellan Market Report
Apr 20, 2012
Summation Index Promises Higher Highs After Correction Ends |
Jan 13, 2012
RASI Above +500 Says Bull Market Not Done |
Oct 21, 2011
McClellan Oscillator Confirms New Uptrend |