September Seasonality Finally Shows Up

Free Chart In Focus email
Delivered to you every week
September has a well-deserved reputation for causing the market trouble, and the week after September options expiration is statistically the worst week of the year (per Rob Hanna of www.quantifiableedges.com). This year, the stock market has been procrastinating about getting that seasonal weakness started, but now that we are in that worst week of the year, the market seems to be working extra hard to make up for lost time.
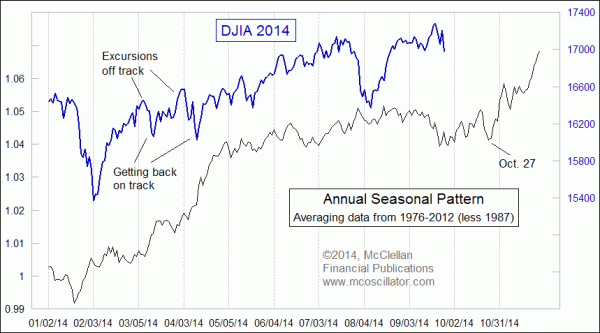
The DJIA made its most recent new all-time high on Sep. 19, 2014. Other indices had already turned down for the traditional September weakness, but the DJIA seemed to swim against that tide. Overall in 2014, the correlation of the DJIA to the annual seasonal pattern has been quite good, but there have been a couple of other times when the DJIA has gone off track, as noted in the chart above. Each time saw the DJIA then work extra hard to get back on track. I believe we are now seeing a repeat of that type of behavior.
The end of September is when the seasonal weakness is due to end, but that is not the same thing as the point when the seasonal strength is due to begin. The standard period of calendar strength lasts from November through April, and it typically starts from an inflection point equating this year to around Oct. 27. Between now and then we should have a great environment to “trade” in, but not yet one to “invest” in. That point will come in about another month.
One point worth noting is that I exclude the data for 1987 from the calculation of this pattern. This is because the magnitudes of both the August 1987 top and the October 1987 crash tend to drown out the voices of the “normal” years. So as with tossing out the high and low judges scores from a figure skating competition, I prefer to eliminate the outlier that is the 1987 pattern, to better portray what normal behavior is supposed to look like.
I will be one of 5 speakers on the program for the Technical Securities Analysts Association annual conference on Oct. 25 in San Francisco. My talk will be about “Truths, Myths, and Magic of the A-D Line”. Visit http://www.tsaasf.org/annual-conference for more information, and to register to attend.
Tom McClellan
Editor, The McClellan Market Report
Sep 27, 2013
Seasonal Pattern |
Aug 07, 2014
2nd Presidential Years Are Different |
Jun 27, 2014
Still The Only Chart That Matters |