Summation Indices’ Messages

Free Chart In Focus email
Delivered to you every week
One of the great magic tricks of the McClellan Summation Index is to tell us when there is or is not sufficient liquidity to continue an uptrend. But the market does not always work perfectly.
We use the Ratio-Adjusted Summation Index (RASI) to make long term historical comparisons. It factors out changes in the number of issues traded. It is calculated the same way as our classic version, with the one adjustment being that daily A-D differences are adjusted by dividing the daily A-D number by Advances plus Declines (A+D), then multiplying the result by +1000. Then we proceed with the calculations of the 10% Trend and 5% Trend as normal to get a Ratio-Adjusted McClellan Oscillator (RAMO), and thus a Ratio Adjusted Summation Index (RASI).
For more on the math, see these articles:
Calculating the McClellan Oscillator
Ratio-Adjusted Summation Index
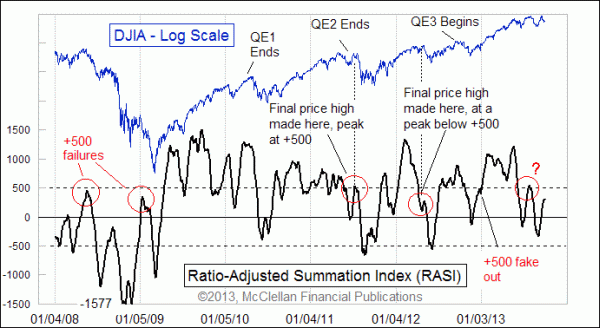
One of the magic messages of the RASI concerns the +500 level. When the RASI dips to a nice oversold level and then tries to rally, it makes a big difference whether the RASI can make it back up above the +500 level or not. If the RASI can climb back up well above +500, then we say that the rally has achieved "escape velocity", a term borrowed from the science of rocketry for describing whether or not a rocket is going fast enough into space to be able to escape Earth's gravitational pull. Failing to get up above +500 is a sign of a rally failure. Going well above it is a sign that the new uptrend is strong, and that we can expect much more in the way of a new uptrend.
The problem is that the +500 level is not a precise line. It is not a case of +501 is good while +499 is bad. +500 sits in the middle of a big gray area. I can say with confidence that a top at only +300 is not good enough, and that a top above +700 is for sure good enough. In between, it gets much harder.
That problem presented itself in a big way just recently, when the RASI topped at +540 on July 26, 2013. That was above the +500 level, but not by very much. So what's the interpretation? There is not a perfect answer.
As it turned out, the major price indices did make it up to a slightly higher high in September 2013. So if one wanted to see the +540 posting as a promise of a higher high, then that message was confirmed. But if one instead wanted to see it as a somewhat equivocal message of liquidity problems, then that message was also confirmed. The market is not always clean and orderly.
Just recently, the market has been making another try at conveying a message about escape velocity, and thus far the attempt is not a positive one. The RASI seems to be topping at a lower level of +315 (subject to subsequent action). If it does indeed turn down from here, that would be a much clearer sign that this latest price push is failing from a breadth perspective. But if the RASI instead keeps going upward, and is able to climb up well above +500, then the market will be telling us that liquidity is plentiful and that we can expect even higher highs.
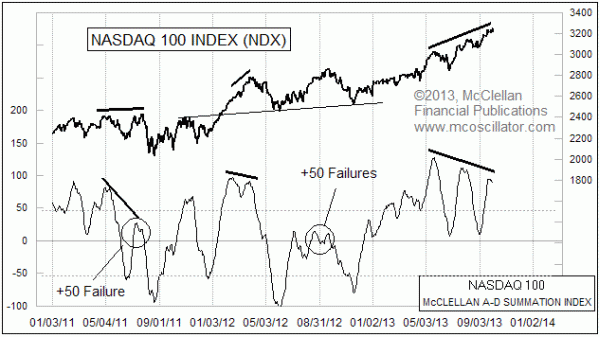
In a similar vein, the Summation Index for the stocks in the Nasdaq 100 Index is also showing a bearish message.

We do not need to ratio-adjust this particular Summation Index because the number of issues (100) never changes. So in this particular version, the +50 level is equivalent to the +500 level for the NYSE's RASI. On that basis, having the NDX's Summation Index get up above +50 usually carries a similar message about "escape velocity" for an uptrend as a NYSE RASI reading above +500.
So that should mean everything is fine now, because the NDX's Summation Index rose well above +50. But the chart also shows that there is a big divergence between the recent price action and the NDX's Summation Index.
Past divergences like this, even if above +50, have meant trouble. And now we have a pretty decisive looking turn downward. When we couple that divergence with the NYSE RASI's failure to climb back up above +500 this time, it is a pretty clear message of liquidity problems for the stock market.
Tom McClellan
Editor, The McClellan Market Report
Nov 15, 2012
Summation Index’s Magic Tricks |
Jan 13, 2012
RASI Above +500 Says Bull Market Not Done |
Sep 10, 2013
Bond CEFs Still Say Liquidity is in Trouble |