Years Ending In 7

Free Chart In Focus email
Delivered to you every week
Everyone knows about annual seasonality, and has heard of “Sell in May and go away”. That slogan persists even though actual seasonal strength typically peaks in August, but nothing good rhymes with August. There is also a strong tendency of the market to show regular patterns on a 10-year basis, now known as the Decennial Pattern. And years ending in the number 7 have an ugly surprise for the bulls.
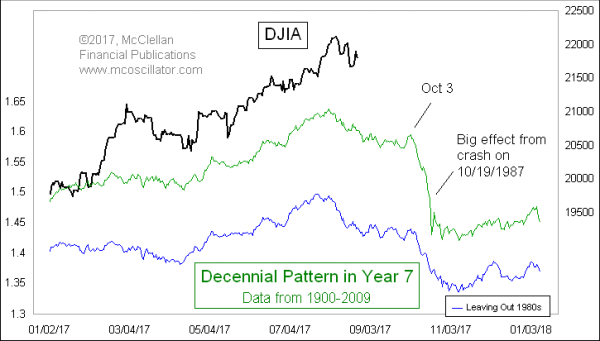
In year 7s, the stock market typically peaks in August and bottoms in early November. And thus far the DJIA seems to be following the pattern very closely. The real decline comes after a peak due Oct. 3.
The worry in following this pattern is that it might be overly influenced by the huge decline that the DJIA experienced in 1987. So in the chart above, I show two versions of the Decennial Pattern, the lower one leaving out the data from the entire decade of the 1980s. This allows us to see that it was not just the effects of the 1987 crash that are pulling down the Pattern in year 7s. It is a persistent effect.
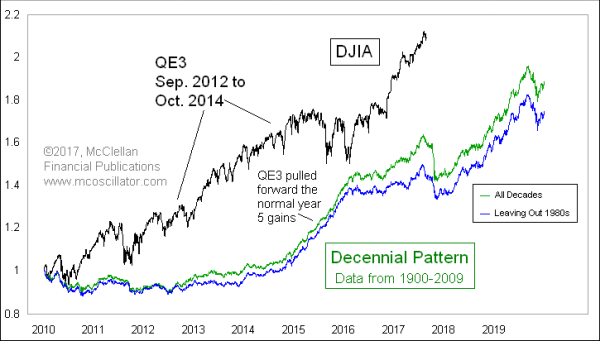
The strong correlation that we are seeing this year between the DJIA and the Decennial Pattern is pretty impressive, and it is worth noting that the DJIA had not been seeing such a strong correlation earlier in this decade. Here is a longer term comparison:

The market strength which is a normal feature of years ending in 5 did not appear this time. I would argue that having the Fed doing $85 billion a month of QE earlier in the decade pulled forward the normal year 5 strength. Then shutting off that free money pushed the market into withdrawal symptoms, like a heroin addict trying to quit cold turkey. Now that we are farther along into the post-intervention era, the market is more free to follow its normal tendencies and we are seeing better correlation to the Decennial Pattern.
If the stock market keeps following the Decennial Pattern with the strong correlation we are seeing now, then we can expect prices to bump along gradually lower, and then accelerate downward once October gets here.
Tom McClellan
Editor, The McClellan Market Report
Further Reading:
We discussed the Decennial Pattern in McClellan Market Report #537, available to subscribers at http://www.mcoscillator.com/reports/market/
The first to describe the Decennial Pattern was economist Edgar Lawrence Smith, in his book Tides and the Affairs of Men (1939). It is also mentioned in book, Technical Analysis: The Complete Resource for Financial Market Technicians, 2007, by Charles Kirkpatrick and Julie Dahlquist, summarized at https://cmtassociation.org/kb/decennial-pattern/.
Larry Williams’ study of it was recently covered in an article at TheStreet.com.
The topic has also been discussed by the Leuthold Group here and here.
Aug 03, 2017
DJIA Arriving at the Real Seasonal Peak |
Jun 08, 2017
The Unexplainable 4-Year Rerun |
Feb 23, 2017
Crude Oil Foretold the Trump Rally 10 Years Ago |