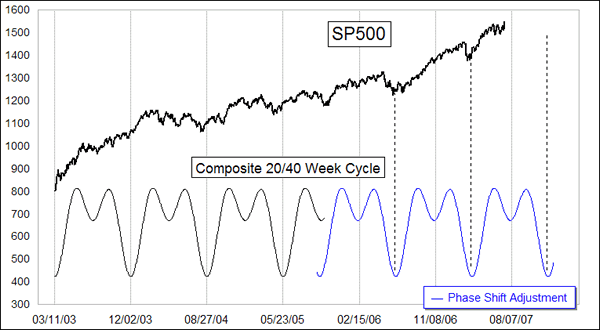
20/40-Week Cycle Phase Shift
Hi, Tom!
I found your commentary about a phase shift in the 40 week S&P cycle to be quite interesting, as I've been at odds with the stock market lately and I've been trying to figure out what's wrong (I think what is mostly wrong is that I've become more of a fundamentalist in regards to the housing downturn, which is clouding my thinking on the technical side).
To try to improve my cycle analysis capabilities, I've recently purchased the TechSignal software from the Foundation for the Study of Cycles. Do you already use the program? I've only started to learn how to use the software, but it is quite fascinating. Attached is a screen shot from the program of the weekly S&P (from April '82 to November '06; not up-to-date because I'm just using the sample data that came with the program, but the cycles shouldn't have changed that much, especially on these weekly charts).
The listing shows the top cycles that TechSignal finds in that data, ranked by the Bartels Index (the lower the number the better, as it suggests that the correlation is not random). I only plotted the synthesis of the 40.40 and the 19.35 cycles, corresponding to the 40 and 20 week cycles you were looking at.
It confirms your projections, roughly, but without the phase shift. I'm not experienced with the program nor smart enough to figure out why it matches your predictions, without the phase shift, but it seemed worth bringing to your attention. I'm guessing that the cycles are dominant enough over a long period of time that it is difficult to determine when to apply a phase shift and when to revert back to the regular cycle pattern. Or it could be dependent on what date the analysis starts, I don't know. The more I delve into this cycle analysis, the more complex it becomes... Kind of like my home remodeling projects... :-)
Best regards,
My understanding is that the software you are using assumes that the subject cycles always exist, albeit with some variability in their actual timing, and does not account for wholesale behavior changes like the phase shift hypothesis I put forward. It appears from the chart that the software also assumes that the 20-week cycle (or its equivalent) is independent of the 40-week's schedule. Based on what I learned in Mechanics of Vibrations class at West Point, this is not a proper understanding of how a half-period harmonic should work. They may be right, but that is not my understanding of it.
My own studies of the 40 week cycle show that once a phase shift occurs, you can forget about the old schedule; it no longer matters. The period of that cycle persists in the new cycle, sort of like when your heart misses a beat but your average pulse rate does not change.

This is definitely an "out there" sort of understanding of how it works, but it is the best explanation I can offer for what I observe in the data.
The key for me is understanding that phase shifts tend to occur every 6-8 years, and so at some point when you realize it has been a while since you have seen one, you need to start factoring its possible appearance into the analysis. Such factoring can take the form of not trusting the cycle as much, and relying on other tools more. It can also take the form of requiring more confirmation of the cycle's arrival than one might otherwise employ. I wish I had done more of that this past summer instead of counting on the 40-week cycle to bottom in September-October.
Were it not for the phase shift phenomenon, the 40-week cycle would be so regular and so reliable that many would come to count on it and know about it. Such knowledge (and the actions taken based on the knowledge) would naturally kill the cycle. So in order to stay alive, the 40-week cycle must remain unreliable enough to fool sufficient numbers of people into not believing in it.