Short Term Price Oscillator
Is there any way that I can calculate the Short Term Price Oscillator (as shown sometimes in the Daily Edition) on a daily basis? What does “50% Trend minus 20% Trend” mean?
end of closing price minus a 5% Trend (also known as a 19-day EMA minus a 39-day EMA). For the STPO, we use a 50% and 20% Trend.
The 50% Trend is a very fast EMA, with a 50% smoothing constant. That means the calculation of today’s EMA value is:
EMA(today) = 0.50xPRICE(today) + 0.50xEMA(yesterday)
The 20% Trend’s formula is:
EMA(today) = 0.20xPRICE(today) + 0.80xEMA(yesterday)
Find the arithmetic difference between them to get the STPO. This is the same process we use for our normal Price Oscillator, except that the EMAs involved there are 10% Trend and 5% Trend.
If you have a charting program, you can have it create the indicator for you if it has a Price Oscillator calculation function. Just select EMAs as the MA type (versus SMA), and set the parameters. All charting programs I have seen refer to EMA speeds in terms of some number of days, instead of the original “X% Trend” nomenclature which we still use. The conversion is:
Smoothing Constant (SC) =
2
—————
n + 1
where n is the number of days. Using algebra procedures, you can convert that formula to
2
n = ————- - 1
(SC)
From that, a 50% Trend is a 3-day EMA, and a 20% Trend is a 9-day EMA.
The STPO can be useful for declaring the current trend direction by moving above or below its zero line. It is also useful for showing overbought and oversold conditions, as well as divergences to price action.
Here is an example of the STPO for the SP500:
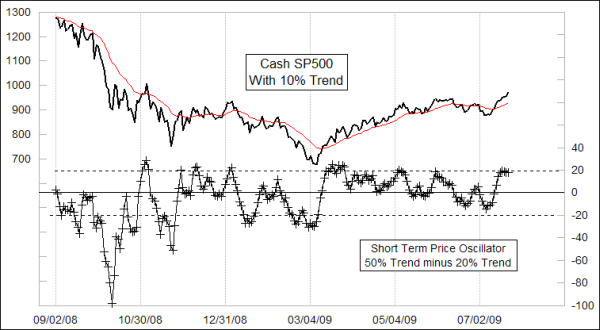
Notice that high or low readings outside the horizontal dashed lines mark extended conditions for the SP500. An important point is that this indicator can stay at an extended level for a long time during a trending move; it does not have to reverse just because it is extended. That is an important insight, because when you see it staying at an extended level and not reversing, that is a big clue that you are in a trending move and not just the sideways chop of a trading range.