Trend Line Touch points
Merry Christmas Tom,
In last night's Daily Edition you have drawn several trend lines to help reach a conclusion. I must say, I'm baffled.
I just don't see triple convergence in trend lines. At multiple points the index has broken through the trend lines that are drawn. In the lower trend line the market breaks through meaningfully, thereby invalidating it and in the upper trend line the market has broken through it. How are they valid?
We were taught by Bill O'Neil that typically trend lines classically needed 3 touch points to remain valid.
I guess I'm just not following what you're trying to present. Honest feedback.
Great question. My position is that for certain purposes, your thesis about a broken line being invalidated is a proper one. What I have seen in my own studies, though, is that broken lines can be subsequently reestablished as valid even after they have been crossed. Prices might climb back up on top of a broken uptrend line and then find support at it to reestablish such validity.
I view such lines as having magic properties, although I cannot explain why they should. Even interior lines (drawn through the middle of a price structure) can still exert future influence.
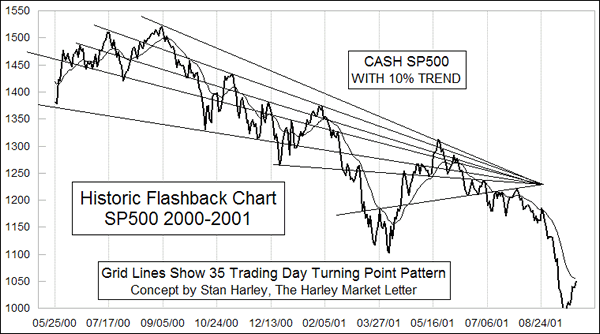
I referred to the 2001 example of 7 separate lines converging. I have attached a chart showing that convergence event. Even though the top that coincided with that convergence event was not the biggest or highest price top, it was nevertheless an important top because it was the top from which prices collapsed aggressively into September 2001. It also helped that it coincided with a 35 day turning point pattern as the gridlines highlight.

We have seen many times that a symmetrical triangle will form, having only 2 lines - the upper and lower boundaries. Eventually, prices break out of every symmetrical (converging) triangle, and often we see the apex of this broken triangle having meaning for prices and/or time. Sometimes the breakout up move will reach a peak at the moment of the apex. A breakdown move out of a triangle can do the same, reaching a trough at the apex. Sometimes prices will retrace back and touch the exact point of the apex after a breakout. For this to happen, and for that apex to have future significance in the ways I have described, the lines forming the apex must still somehow be "alive".
If you stripped away all of the lines except perhaps the uppermost declining tops line and the broken declining bottoms line (3rd from the bottom), then you would have an apex worthy of interest. Taking your ruler then and drawing backward from this apex, I find it fascinating that lines can be found (as was done here) which connect any two or more interior turning points and still run through the apex. There has to be some heavy physics going on in the control of price movements to allow for such a possibility. I do not mean that any person or human entity is doing this; it is something much more metaphysical.
It is also fascinating to see that the apex of all of these converging lines happens to have coincided with the final top from which prices headed down into September 2001. Prices were already headed downward when the 9/11 attacks arrived to push them down even further.
I am not sure if that completely answers your question; it would probably take a book to cover the topic completely. But hopefully it gives you some food for thought. Thanks for the good feedback.