Is a January Decline Bearish? (20/40-week Cycle)
We heard a lot of discussion in the technical analysis community back in January 2005 about the notion of a January low in proximity to lows. Much of that centered on studies of the "January Barometer", which posits that the market's performance during January is an important indication of how the year will go. I think that one of the main weaknesses of that whole thesis is that it presumes a greater importance or relevance of the Julian calendar's effects on the market's movements than may be deserved. Technician and author Chris Carolan, who wrote The Spiral Calendar, can likely do a better job than I can of providing a more expansive conceptual view of what the market's "real" calendar is like. The following was written about that very topic back in February 2005. -TM
I would like to share a chart that may put the market's recent dip into better perspective. The lower indicator in this attached chart shows a representation of the composite 20/40-week cycle. The 40-week cycle is also known as the 9-month cycle, and the 20-week cycle is its 1/2 period harmonic. Cycle length in charts of the stock market is measured from trough to trough. In other markets or data series, such as gold, a peak to peak measurement is more appropriate. J.M. Hurst was the guy who did the real pioneering work with these cycles.
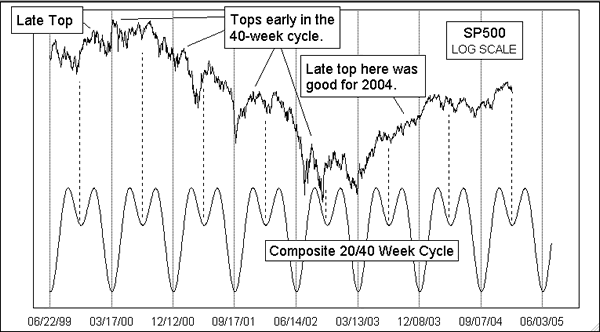
The 40-week cycle lows tend to be the more significant bottoms, and they also tend to be more punctual. Notice that the September 2001 bottom happened to be a 40-week bottom; I contend that the market would have bottomed then anyway, and the 9/11 attacks just increased the amplitude of the downswing and rebound without altering its timing that much. The July 2002 bottom was about a month late, which was a pretty unusual amount of deviation from the ideal bottom date, but on the next iteration the market got back into phase with the normal schedule.
The 20-week bottoms are usually not as significant as the 40-week bottoms, even though they might feel pretty significant at the time, and they also are not as precisely punctual, arriving early or later than the ideal.
The point that I want to make relative to the whole January bottom versus December/November discussion is this: When we analyze the bactrian humps of the price action relative to this cycle pattern, we can get information about what lies ahead. If the tops for a given 40-week cycle arrive early within the 40-week period, that is a bearish sign for the market during the next 40-week period. That is known as "left translation". You can see that during the 2000-2003 decline, the tops were coming early in each 40-week period, and even early within each 20-week hump. But beginning with the March 2003 bottom, the market switched into a bull market mode with a "right translation" of the location of the cycle highs, and with the second 20-week peak coming at a higher price level than the first. This is bullish behavior.
The early 2004 top in the SP500 was higher than the June 2004 top by a small amount, which is not very bullish behavior. But the Dec. 30, 2004 high in the SP500 occurred later than the ideal top date of the 20-week cycle, and that is seemingly a return to more bullish behavior. We will want to see the second 20-week cycle high of this current 40-week cycle arriving at a higher price level than the first one to tell us that the bullish behavior is continuing. It would also be a bullish sign to have that second top arrive later than the ideal 20-week cycle top date of March 17. If the SP500 fails to exceed its Dec. 30, 2004 high close of 1213 on this second 20-week cycle high, then that would mean that the market is switching into a more bearish mode. That would make it extremely unlikely that the whole "year 5 in a decade being up" phenomenon would work this year. If the year 5 behavior does fail to bring an up year this time, then all of the January Barometer fans will fall all over themselves in self-congratulation for having seen a down January to forecast that outcome, and they will be absolutely impossible to live with come next January. A year 5 failure is not what I am projecting, but it is what we should watch for.
This bactrian sine wave is easy to create in a spreadsheet, by combining two normal sine waves of different periods. This is done just for visual analysis purposes, and a deeper more intensive study of cycle periods requires somewhat more sophisticated tools. But even this cursory view of the price behavior relative to this ideal pattern can give us important predictive information, and we can then switch to our confirming indicators when an important turning point draws near.